Berkshire Hathaway 2012 Annual Report Download - page 33
Download and view the complete annual report
Please find page 33 of the 2012 Berkshire Hathaway annual report below. You can navigate through the pages in the report by either clicking on the pages listed below, or by using the keyword search tool below to find specific information within the annual report.-
 1
1 -
2
-
3
-
4
-
5
-
6
-
7
-
8
-
9
-
10
-
11
-
12
-
13
-
14
-
15
-
16
-
17
-
18
-
19
-
20
-
21
-
22
-
 23
23 -
 24
24 -
 25
25 -
 26
26 -
 27
27 -
 28
28 -
 29
29 -
 30
30 -
 31
31 -
 32
32 -
 33
33 -
 34
34 -
 35
35 -
 36
36 -
 37
37 -
 38
38 -
 39
39 -
 40
40 -
 41
41 -
 42
42 -
 43
43 -
44
-
45
-
46
-
47
-
48
-
49
-
50
-
51
-
52
-
53
-
54
-
55
-
56
-
57
-
58
-
59
-
60
-
61
-
62
-
63
-
64
-
65
-
66
-
67
-
68
-
69
-
70
-
71
-
72
-
73
-
74
-
75
-
76
-
77
-
78
-
79
-
80
-
81
-
82
-
83
-
84
-
85
-
86
-
87
-
88
-
89
-
90
-
91
-
92
-
93
-
94
-
95
-
96
-
97
-
98
-
99
-
100
-
101
-
102
-
103
-
104
-
105
-
106
-
107
-
108
-
109
-
110
-
111
-
112
 |
 |

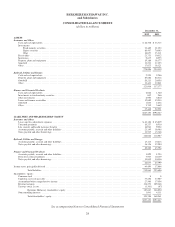
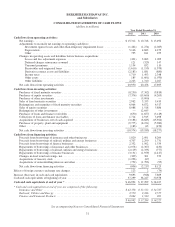
BERKSHIRE HATHAWAY INC.
and Subsidiaries
CONSOLIDATED STATEMENTS OF CASH FLOWS
(dollars in millions)
Year Ended December 31,
2012 2011 2010
Cash flows from operating activities:
Net earnings ................................................................ $15,312 $ 10,746 $ 13,494
Adjustments to reconcile net earnings to operating cash flows:
Investment (gains) losses and other-than-temporary impairment losses ............. (1,462) (1,274) (2,085)
Depreciation ............................................................ 5,146 4,683 4,279
Other ................................................................. 795 811 255
Changes in operating assets and liabilities before business acquisitions:
Losses and loss adjustment expenses ........................................ (421) 3,063 1,009
Deferred charges reinsurance assumed ....................................... 121 (329) 147
Unearned premiums ...................................................... 1,134 852 110
Receivables and originated loans ........................................... (1,610) (1,159) (1,979)
Derivative contract assets and liabilities ...................................... (2,183) 1,881 (880)
Income taxes ........................................................... 1,710 1,493 2,348
Other assets ............................................................ 185 (1,601) (1,070)
Other liabilities ......................................................... 2,223 1,310 2,267
Net cash flows from operating activities .......................................... 20,950 20,476 17,895
Cash flows from investing activities:
Purchases of fixed maturity securities ............................................ (8,250) (7,362) (9,819)
Purchases of equity securities .................................................. (7,376) (15,660) (4,265)
Purchases of other investments ................................................. — (5,000) —
Sales of fixed maturity securities ............................................... 2,982 3,353 5,435
Redemptions and maturities of fixed maturity securities ............................. 6,064 6,872 6,517
Sales of equity securities ...................................................... 8,088 1,518 5,886
Redemptions of other investments .............................................. — 12,645 —
Purchases of loans and finance receivables ........................................ (650) (1,657) (3,149)
Collections of loans and finance receivables ...................................... 1,714 2,915 3,498
Acquisitions of businesses, net of cash acquired ................................... (3,188) (8,685) (15,924)
Purchases of property, plant and equipment ....................................... (9,775) (8,191) (5,980)
Other ..................................................................... (183) 63 (476)
Net cash flows from investing activities .......................................... (10,574) (19,189) (18,277)
Cash flows from financing activities:
Proceeds from borrowings of insurance and other businesses ......................... 1,820 2,091 8,204
Proceeds from borrowings of railroad, utilities and energy businesses .................. 4,707 2,290 1,731
Proceeds from borrowings of finance businesses ................................... 2,352 1,562 1,539
Repayments of borrowings of insurance and other businesses ......................... (2,078) (2,307) (430)
Repayments of borrowings of railroad, utilities and energy businesses .................. (2,119) (2,335) (777)
Repayments of borrowings of finance businesses .................................. (3,131) (1,959) (2,417)
Changes in short term borrowings, net ........................................... (309) 301 370
Acquisitions of treasury stock .................................................. (1,296) (67) —
Acquisitions of noncontrolling interests and other .................................. (752) (1,793) (95)
Net cash flows from financing activities .......................................... (806) (2,217) 8,125
Effects of foreign currency exchange rate changes ...................................... 123 2 (74)
Increase (decrease) in cash and cash equivalents ....................................... 9,693 (928) 7,669
Cash and cash equivalents at beginning of year ........................................ 37,299 38,227 30,558
Cash and cash equivalents at end of year * .......................................... $46,992 $ 37,299 $ 38,227
* Cash and cash equivalents at end of year are comprised of the following:
Insurance and Other ......................................................... $ 42,358 $ 33,513 $ 34,767
Railroad, Utilities and Energy ................................................. 2,570 2,246 2,557
Finance and Financial Products ................................................ 2,064 1,540 903
$ 46,992 $ 37,299 $ 38,227
See accompanying Notes to Consolidated Financial Statements
31