Berkshire Hathaway 2012 Annual Report Download - page 78
Download and view the complete annual report
Please find page 78 of the 2012 Berkshire Hathaway annual report below. You can navigate through the pages in the report by either clicking on the pages listed below, or by using the keyword search tool below to find specific information within the annual report.-
 1
1 -
2
-
3
-
4
-
5
-
6
-
7
-
8
-
9
-
10
-
11
-
12
-
13
-
14
-
15
-
16
-
17
-
18
-
19
-
20
-
21
-
22
-
23
-
24
-
25
-
26
-
27
-
28
-
29
-
30
-
31
-
32
-
33
-
34
-
35
-
36
-
37
-
38
-
39
-
40
-
41
-
42
-
43
-
44
-
45
-
46
-
47
-
48
-
49
-
50
-
51
-
52
-
53
-
54
-
55
-
56
-
57
-
58
-
59
-
60
-
61
-
62
-
63
-
64
-
65
-
66
-
67
-
 68
68 -
 69
69 -
 70
70 -
 71
71 -
 72
72 -
 73
73 -
 74
74 -
 75
75 -
 76
76 -
 77
77 -
 78
78 -
 79
79 -
 80
80 -
 81
81 -
 82
82 -
 83
83 -
 84
84 -
 85
85 -
 86
86 -
 87
87 -
 88
88 -
89
-
90
-
91
-
92
-
93
-
94
-
95
-
96
-
97
-
98
-
99
-
100
-
101
-
102
-
103
-
104
-
105
-
106
-
107
-
108
-
109
-
110
-
111
-
112
 |
 |

Management’s Discussion (Continued)
Utilities and Energy (“MidAmerican”) (Continued)
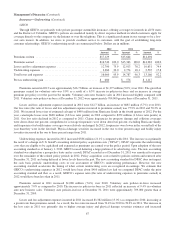
million in 2011 was unchanged from 2010. The effect of the declines in revenues were essentially offset by lower energy costs,
which was driven by lower sales volumes, and to a lesser degree, by lower net interest expense.
In 2012, natural gas pipelines’ revenues and EBIT declined $15 million and $5 million, respectively, compared to 2011. In
2012, natural gas revenues increased from expansion projects and from higher transportation and storage rates in certain
markets, which were more than offset by lower volumes of gas and condensate liquids sales (which are offset in cost of sales)
and the impact of contract expirations. In 2012, EBIT also reflected increased depreciation expense, partially offset by lower
interest expense. Natural gas pipelines’ revenues and EBIT in 2011 were relatively unchanged from 2010.
Northern Powergrid’s revenues in 2012 increased $20 million (2%) while EBIT declined $40 million (9%) compared to
2011. In 2012, revenues were negatively impacted by currency-related declines from a stronger U.S. Dollar. Excluding currency
related impacts, distribution revenues increased $28 million in 2012, reflecting higher tariff rates ($76 million), partially offset
by the impact of higher regulatory provisions in 2011 ($55 million). Northern Powergrid’s EBIT in 2012 was negatively
affected by increases in pension expense ($44 million) and distribution operating expenses ($21 million), which more than
offset the increase in distribution revenues.
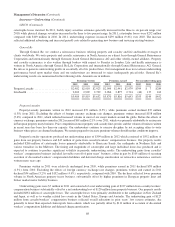
Revenues of Northern Powergrid were $1,016 million in 2011, an increase of $212 million (26%) from 2010. The increase
was primarily due to an increase of $197 million in distribution revenues, and to a lesser degree to a weaker U.S. Dollar. EBIT
in 2011 was $469 million, an increase of $136 million (41%) over 2010. The increase in EBIT was also primarily due to higher
distribution revenues and the weaker U.S. Dollar, partially offset by the impact of a $45 million gain on the sale of a subsidiary
in 2010.
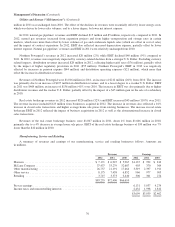
Real estate brokerage revenues in 2012 increased $326 million (32%) and EBIT increased $43 million (110%) over 2011.
The revenue increase included $123 million from businesses acquired in 2012. The increase in revenues also reflected a 16%
increase in closed sales transactions and higher average home sale prices from existing businesses. The increase in real estate
brokerage EBIT in 2012 reflected the impact of business acquisitions in 2012 as well as the aforementioned increase in closed
sales transactions.
Revenues of the real estate brokerage business were $1,007 million in 2011, down 4% from $1,046 million in 2010,
primarily due to a 4% decrease in average home sale prices. EBIT of the real estate brokerage business of $39 million was 7%
lower than the $42 million in 2010.
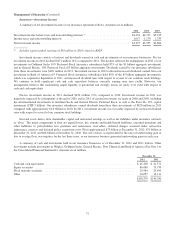
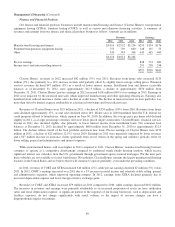
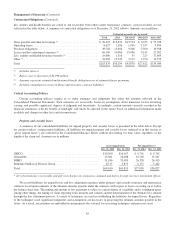
Manufacturing, Service and Retailing
A summary of revenues and earnings of our manufacturing, service and retailing businesses follows. Amounts are
in millions.
Revenues Earnings
2012 2011 2010 2012 2011 2010
Marmon ................................................ $ 7,171 $ 6,925 $ 5,967 $1,137 $ 992 $ 813
McLane Company ........................................ 37,437 33,279 32,687 403 370 369
Other manufacturing ...................................... 26,757 21,191 17,664 3,319 2,397 1,911
Other service ............................................ 8,175 7,438 6,852 966 977 905
Retailing ............................................... 3,715 3,573 3,440 306 301 276
$83,255 $72,406 $66,610
Pre-tax earnings .......................................... 6,131 5,037 4,274
Income taxes and noncontrolling interests ..................... 2,432 1,998 1,812
$3,699 $3,039 $2,462
76