Berkshire Hathaway 2012 Annual Report Download - page 79
Download and view the complete annual report
Please find page 79 of the 2012 Berkshire Hathaway annual report below. You can navigate through the pages in the report by either clicking on the pages listed below, or by using the keyword search tool below to find specific information within the annual report.-
 1
1 -
2
-
3
-
4
-
5
-
6
-
7
-
8
-
9
-
10
-
11
-
12
-
13
-
14
-
15
-
16
-
17
-
18
-
19
-
20
-
21
-
22
-
23
-
24
-
25
-
26
-
27
-
28
-
29
-
30
-
31
-
32
-
33
-
34
-
35
-
36
-
37
-
38
-
39
-
40
-
41
-
42
-
43
-
44
-
45
-
46
-
47
-
48
-
49
-
50
-
51
-
52
-
53
-
54
-
55
-
56
-
57
-
58
-
59
-
60
-
61
-
62
-
63
-
64
-
65
-
66
-
67
-
68
-
 69
69 -
 70
70 -
 71
71 -
 72
72 -
 73
73 -
 74
74 -
 75
75 -
 76
76 -
 77
77 -
 78
78 -
 79
79 -
 80
80 -
 81
81 -
 82
82 -
 83
83 -
 84
84 -
 85
85 -
 86
86 -
 87
87 -
 88
88 -
 89
89 -
90
-
91
-
92
-
93
-
94
-
95
-
96
-
97
-
98
-
99
-
100
-
101
-
102
-
103
-
104
-
105
-
106
-
107
-
108
-
109
-
110
-
111
-
112
 |
 |
Management’s Discussion (Continued)
Manufacturing, Service and Retailing (Continued)
Marmon
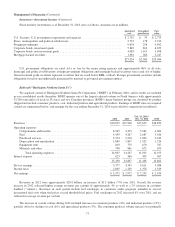
Through Marmon, we operate approximately 150 manufacturing and service businesses that operate independently within
eleven diverse business sectors. Marmon’s revenues in 2012 were approximately $7.2 billion, an increase of 3.6% over 2011.
Revenue increases attributable to bolt-on acquisitions in the Crane Services, Highway Technologies, Engineered Wire & Cable
and Distribution Services sectors were substantially offset by the impact of lower copper prices in the Building Wire and Flow
Products sectors. However, significant organic growth occurred within the Distribution Services, Transportation Services &
Engineered Products (“TSEP”), Highway Technologies and Water Treatment sectors. Despite falling steel prices, Distribution
Services increased market share in their market niches, driving annual revenues up 5% over 2011. Higher rail fleet utilization
and higher rental rates, offset by lower external sales of railroad tank cars, provided most of the TSEP growth and sulfur
equipment installations in the Middle East provided the balance. Commercial and heavy haul trailers have driven the increase in
Highway Technologies, while projects for the Canadian Tar Sands area provided growth in Water Treatment. These increases
were somewhat offset by revenue declines in the Flow Products and Building Wire sectors due to the persistent slowdown in
commercial construction. Retail Store Fixtures continued to suffer from a reduction in volume from its major customer, which
resulted in a 14% decline in revenues for 2012.
Pre-tax earnings in 2012 were $1.1 billion, an increase of 14.6% over 2011. Approximately 25% of the overall increase in
pre-tax earnings was attributable to bolt-on acquisitions. Excluding the effects of these acquisitions, eight of the eleven Marmon
business sectors produced increased pre-tax earnings in 2012 compared to 2011. Among the sectors reporting the largest dollar
increases in pre-tax earnings were the TSEP, Highway Technologies, Distribution Services and Water Treatment sectors
reflecting the aforementioned revenue growth. In addition, Engineered Wire & Cable sector’s pre-tax earnings rose 24%
attributable to restructuring actions taken in 2011 in the utility and commodity-driven businesses, along with growth in that
sector’s specialty wire niches. Flow Products, Building Wire and Retail Store Fixtures sectors reported lower 2012 pre-tax
earnings consistent with the revenue declines previously discussed. In 2012, consolidated pre-tax earnings as a percentage of
revenues were 15.9% compared to 14.3% in 2011.
The improvement in operating results in 2012 reflects the continued emphasis of Marmon’s business model, which fosters
margin growth. Consistent with this model, most of the growth in 2012 was in higher margin sectors that focus on niche
markets. In addition, improvements in revenues and pre-tax earnings also generally reflected continued strength in some of
Marmon’s end markets, recent new product introductions and ongoing efforts to control overhead costs.
Revenues in 2011 were $6.9 billion, an increase of approximately 16% over 2010. An estimated 25% of the aggregate
revenue increase was attributed to increased copper prices affecting the Building Wire and Flow Products sectors, where copper
cost increases are passed on to customers with little or no margin. Ten of the eleven business sectors produced comparative
revenue increases. The only sector reporting a comparative revenue decrease was the Retail Store Fixtures sector, where its
largest customer significantly reduced its purchases. Pre-tax earnings in 2011 were $992 million, an increase of approximately
22% over 2010. Pre-tax earnings in 2011 increased in all sectors except Retail Store Fixtures consistent with the revenue decline
previously discussed. Pre-tax earnings as a percent of revenues were 14.3% in 2011 and 13.6% in 2010.
McLane Company
Through McLane, we operate a wholesale distribution business that provides grocery and non-food products to retailers,
convenience stores and restaurants. McLane’s business is marked by high sales volume and very low profit margins. McLane’s
significant customers include Wal-Mart, 7-Eleven and Yum! Brands. In 2010, McLane acquired Empire Distributors
(“Empire”), based in Georgia and North Carolina, and Horizon Wine and Spirits Inc. (“Horizon”), based in Tennessee. Empire
and Horizon are wholesale distributors of distilled spirits, wine and beer. On August 24, 2012, McLane acquired Meadowbrook
Meat Company, Inc. (“MBM”). MBM, based in Rocky Mount, North Carolina, is a large customized foodservice distributor for
national restaurant chains with annual revenues of approximately $6 billion. MBM’s revenues and earnings were included in
McLane’s results beginning as of the acquisition date. Approximately 28% of McLane’s consolidated revenues in 2012 were
attributable to Wal-Mart. A curtailment of purchasing by Wal-Mart or another of its significant customers could have a material
adverse impact on McLane’s periodic revenues and earnings.
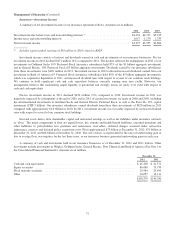
McLane’s revenues were approximately $37.4 billion in 2012, an increase of about $4.2 billion (12.5%) over 2011. The
increase in revenues was attributable to the MBM acquisition, as well as 6% to 8% revenue increases in McLane’s grocery,
77