Berkshire Hathaway 2012 Annual Report Download - page 31
Download and view the complete annual report
Please find page 31 of the 2012 Berkshire Hathaway annual report below. You can navigate through the pages in the report by either clicking on the pages listed below, or by using the keyword search tool below to find specific information within the annual report.-
 1
1 -
2
-
3
-
4
-
5
-
6
-
7
-
8
-
9
-
10
-
11
-
12
-
13
-
14
-
15
-
16
-
17
-
18
-
19
-
20
-
 21
21 -
 22
22 -
 23
23 -
 24
24 -
 25
25 -
 26
26 -
 27
27 -
 28
28 -
 29
29 -
 30
30 -
 31
31 -
 32
32 -
 33
33 -
 34
34 -
 35
35 -
 36
36 -
 37
37 -
 38
38 -
 39
39 -
 40
40 -
 41
41 -
42
-
43
-
44
-
45
-
46
-
47
-
48
-
49
-
50
-
51
-
52
-
53
-
54
-
55
-
56
-
57
-
58
-
59
-
60
-
61
-
62
-
63
-
64
-
65
-
66
-
67
-
68
-
69
-
70
-
71
-
72
-
73
-
74
-
75
-
76
-
77
-
78
-
79
-
80
-
81
-
82
-
83
-
84
-
85
-
86
-
87
-
88
-
89
-
90
-
91
-
92
-
93
-
94
-
95
-
96
-
97
-
98
-
99
-
100
-
101
-
102
-
103
-
104
-
105
-
106
-
107
-
108
-
109
-
110
-
111
-
112
 |
 |

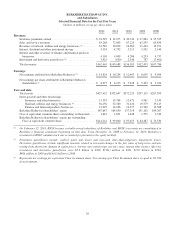
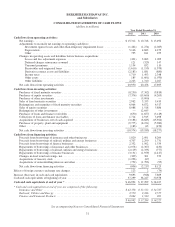
BERKSHIRE HATHAWAY INC.
and Subsidiaries
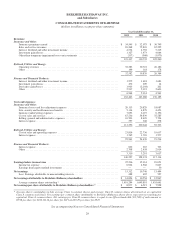
CONSOLIDATED STATEMENTS OF EARNINGS
(dollars in millions except per-share amounts)
Year Ended December 31,
2012 2011 2010
Revenues:
Insurance and Other:
Insurance premiums earned ...................................................... $ 34,545 $ 32,075 $ 30,749
Sales and service revenues ....................................................... 83,268 72,803 67,225
Interest, dividend and other investment income ....................................... 4,534 4,792 5,215
Investment gains/losses .......................................................... 1,327 1,973 4,044
Other-than-temporary impairment losses on investments ............................... (337) (908) (1,973)
123,337 110,735 105,260
Railroad, Utilities and Energy:
Operating revenues ............................................................. 32,383 30,721 26,186
Other ........................................................................ 199 118 178
32,582 30,839 26,364
Finance and Financial Products:
Interest, dividend and other investment income ....................................... 1,572 1,618 1,683
Investment gains/losses .......................................................... 472 209 14
Derivative gains/losses .......................................................... 1,963 (2,104) 261
Other ........................................................................ 2,537 2,391 2,603
6,544 2,114 4,561
162,463 143,688 136,185
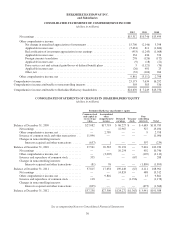
Costs and expenses:
Insurance and Other:
Insurance losses and loss adjustment expenses ....................................... 20,113 20,829 18,087
Life, annuity and health insurance benefits .......................................... 5,114 4,879 4,453
Insurance underwriting expenses .................................................. 7,693 6,119 6,196
Cost of sales and services ........................................................ 67,536 59,839 55,585
Selling, general and administrative expenses ......................................... 10,503 8,670 7,704
Interest expense ................................................................ 397 308 278
111,356 100,644 92,303
Railroad, Utilities and Energy:
Cost of sales and operating expenses ............................................... 23,816 22,736 19,637
Interest expense ................................................................ 1,745 1,703 1,577
25,561 24,439 21,214
Finance and Financial Products:
Interest expense ................................................................ 602 653 703
Other ........................................................................ 2,708 2,638 2,914
3,310 3,291 3,617
140,227 128,374 117,134
Earnings before income taxes ....................................................... 22,236 15,314 19,051
Income tax expense ............................................................. 6,924 4,568 5,607
Earnings from equity method investments ........................................... — — 50
Net earnings ...................................................................... 15,312 10,746 13,494
Less: Earnings attributable to noncontrolling interests .................................. 488 492 527
Net earnings attributable to Berkshire Hathaway shareholders ........................... $ 14,824 $ 10,254 $ 12,967
Average common shares outstanding * ............................................. 1,651,294 1,649,891 1,635,661
Net earnings per share attributable to Berkshire Hathaway shareholders * ................. $ 8,977 $ 6,215 $ 7,928
* Average shares outstanding include average Class A common shares and average Class B common shares determined on an equivalent
Class A common stock basis. Net earnings per common share attributable to Berkshire Hathaway shown above represents net earnings per
equivalent Class A common share. Net earnings per Class B common share is equal to one-fifteen-hundredth (1/1,500) of such amount or
$5.98 per share for 2012, $4.14 per share for 2011 and $5.29 per share for 2010.
See accompanying Notes to Consolidated Financial Statements
29