Berkshire Hathaway 2012 Annual Report Download - page 15
Download and view the complete annual report
Please find page 15 of the 2012 Berkshire Hathaway annual report below. You can navigate through the pages in the report by either clicking on the pages listed below, or by using the keyword search tool below to find specific information within the annual report.-
 1
1 -
2
-
3
-
4
-
 5
5 -
 6
6 -
 7
7 -
 8
8 -
 9
9 -
 10
10 -
 11
11 -
 12
12 -
 13
13 -
 14
14 -
 15
15 -
 16
16 -
 17
17 -
 18
18 -
 19
19 -
 20
20 -
 21
21 -
 22
22 -
 23
23 -
 24
24 -
 25
25 -
26
-
27
-
28
-
29
-
30
-
31
-
32
-
33
-
34
-
35
-
36
-
37
-
38
-
39
-
40
-
41
-
42
-
43
-
44
-
45
-
46
-
47
-
48
-
49
-
50
-
51
-
52
-
53
-
54
-
55
-
56
-
57
-
58
-
59
-
60
-
61
-
62
-
63
-
64
-
65
-
66
-
67
-
68
-
69
-
70
-
71
-
72
-
73
-
74
-
75
-
76
-
77
-
78
-
79
-
80
-
81
-
82
-
83
-
84
-
85
-
86
-
87
-
88
-
89
-
90
-
91
-
92
-
93
-
94
-
95
-
96
-
97
-
98
-
99
-
100
-
101
-
102
-
103
-
104
-
105
-
106
-
107
-
108
-
109
-
110
-
111
-
112
 |
 |
A “non-real” amortization charge at Wells Fargo, however, is not highlighted by the company and never, to
my knowledge, has been noted in analyst reports. The earnings that Wells Fargo reports are heavily burdened by an
“amortization of core deposits” charge, the implication being that these deposits are disappearing at a fairly rapid
clip. Yet core deposits regularly increase. The charge last year was about $1.5 billion. In no sense, except GAAP
accounting, is this whopping charge an expense.
And that ends today’s accounting lecture. Why is no one shouting “More, more?”
************
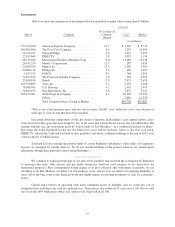
The crowd of companies in this section sell products ranging from lollipops to jet airplanes. Some of the
businesses enjoy terrific economics, measured by earnings on unleveraged net tangible assets that run from 25%
after-tax to more than 100%. Others produce good returns in the area of 12-20%. A few, however, have very poor
returns, a result of some serious mistakes I made in my job of capital allocation.
More than 50 years ago, Charlie told me that it was far better to buy a wonderful business at a fair price
than to buy a fair business at a wonderful price. Despite the compelling logic of his position, I have sometimes
reverted to my old habit of bargain-hunting, with results ranging from tolerable to terrible. Fortunately, my mistakes
have usually occurred when I made smaller purchases. Our large acquisitions have generally worked out well and,
in a few cases, more than well.
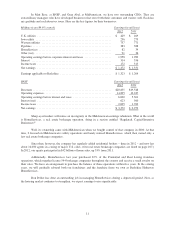
Viewed as a single entity, therefore, the companies in this group are an excellent business. They employ
$22.6 billion of net tangible assets and, on that base, earned 16.3% after-tax.
Of course, a business with terrific economics can be a bad investment if the price paid is excessive. We
have paid substantial premiums to net tangible assets for most of our businesses, a cost that is reflected in the large
figure we show for intangible assets. Overall, however, we are getting a decent return on the capital we have
deployed in this sector. Furthermore, the intrinsic value of the businesses, in aggregate, exceeds their carrying value
by a good margin. Even so, the difference between intrinsic value and carrying value in the insurance and regulated-
industry segments is far greater. It is there that the huge winners reside.
************
Marmon provides an example of a clear and substantial gap existing between book value and intrinsic
value. Let me explain the odd origin of this differential.
Last year I told you that we had purchased additional shares in Marmon, raising our ownership to 80% (up
from the 64% we acquired in 2008). I also told you that GAAP accounting required us to immediately record the
2011 purchase on our books at far less than what we paid. I’ve now had a year to think about this weird accounting
rule, but I’ve yet to find an explanation that makes any sense – nor can Charlie or Marc Hamburg, our CFO, come
up with one. My confusion increases when I am told that if we hadn’t already owned 64%, the 16% we purchased
in 2011 would have been entered on our books at our cost.
In 2012 (and in early 2013, retroactive to yearend 2012) we acquired an additional 10% of Marmon and the
same bizarre accounting treatment was required. The $700 million write-off we immediately incurred had no effect
on earnings but did reduce book value and, therefore, 2012’s gain in net worth.
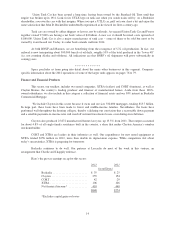
The cost of our recent 10% purchase implies a $12.6 billion value for the 90% of Marmon we now own.
Our balance-sheet carrying value for the 90%, however, is $8 billion. Charlie and I believe our current purchase
represents excellent value. If we are correct, our Marmon holding is worth at least $4.6 billion more than its
carrying value.
Marmon is a diverse enterprise, comprised of about 150 companies operating in a wide variety of
industries. Its largest business involves the ownership of tank cars that are leased to a variety of shippers, such as oil
and chemical companies. Marmon conducts this business through two subsidiaries, Union Tank Car in the U.S. and
Procor in Canada.
13