Berkshire Hathaway 2012 Annual Report Download - page 17
Download and view the complete annual report
Please find page 17 of the 2012 Berkshire Hathaway annual report below. You can navigate through the pages in the report by either clicking on the pages listed below, or by using the keyword search tool below to find specific information within the annual report.
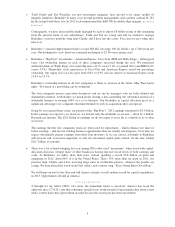
Investments
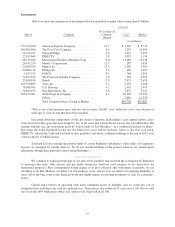
Below we show our common stock investments that at yearend had a market value of more than $1 billion.
12/31/12
Shares Company
Percentage of
Company
Owned
Cost* Market
(in millions)
151,610,700 American Express Company .............. 13.7 $ 1,287 $ 8,715
400,000,000 The Coca-Cola Company ................. 8.9 1,299 14,500
24,123,911 ConocoPhillips ......................... 2.0 1,219 1,399
22,999,600 DIRECTV ............................ 3.8 1,057 1,154
68,115,484 International Business Machines Corp. ...... 6.0 11,680 13,048
28,415,250 Moody’s Corporation .................... 12.7 287 1,430
20,060,390 Munich Re ............................ 11.3 2,990 3,599
20,668,118 Phillips 66 ............................ 3.3 660 1,097
3,947,555 POSCO ............................... 5.1 768 1,295
52,477,678 The Procter & Gamble Company ........... 1.9 336 3,563
25,848,838 Sanofi ................................ 2.0 2,073 2,438
415,510,889 Tesco plc ............................. 5.2 2,350 2,268
78,060,769 U.S. Bancorp .......................... 4.2 2,401 2,493
54,823,433 Wal-Mart Stores, Inc. .................... 1.6 2,837 3,741
456,170,061 Wells Fargo & Company ................. 8.7 10,906 15,592
Others ................................ 7,646 11,330
Total Common Stocks Carried at Market .... $49,796 $87,662
*This is our actual purchase price and also our tax basis; GAAP “cost” differs in a few cases because of
write-ups or write-downs that have been required.
One point about the composition of this list deserves mention. In Berkshire’s past annual reports, every
stock itemized in this space has been bought by me, in the sense that I made the decision to buy it for Berkshire. But
starting with this list, any investment made by Todd Combs or Ted Weschler – or a combined purchase by them –
that meets the dollar threshold for the list ($1 billion this year) will be included. Above is the first such stock,
DIRECTV, which both Todd and Ted hold in their portfolios and whose combined holdings at the end of 2012 were
valued at the $1.15 billion shown.
Todd and Ted also manage the pension funds of certain Berkshire subsidiaries, while others, for regulatory
reasons, are managed by outside advisers. We do not include holdings of the pension funds in our annual report
tabulations, though their portfolios often overlap Berkshire’s.
************
We continue to wind down the part of our derivatives portfolio that involved the assumption by Berkshire
of insurance-like risks. (Our electric and gas utility businesses, however, will continue to use derivatives for
operational purposes.) New commitments would require us to post collateral and, with minor exceptions, we are
unwilling to do that. Markets can behave in extraordinary ways, and we have no interest in exposing Berkshire to
some out-of-the-blue event in the financial world that might require our posting mountains of cash on a moment’s
notice.
Charlie and I believe in operating with many redundant layers of liquidity, and we avoid any sort of
obligation that could drain our cash in a material way. That reduces our returns in 99 years out of 100. But we will
survive in the 100th while many others fail. And we will sleep well in all 100.
15


