Berkshire Hathaway 2012 Annual Report Download - page 74
Download and view the complete annual report
Please find page 74 of the 2012 Berkshire Hathaway annual report below. You can navigate through the pages in the report by either clicking on the pages listed below, or by using the keyword search tool below to find specific information within the annual report.-
 1
1 -
2
-
3
-
4
-
5
-
6
-
7
-
8
-
9
-
10
-
11
-
12
-
13
-
14
-
15
-
16
-
17
-
18
-
19
-
20
-
21
-
22
-
23
-
24
-
25
-
26
-
27
-
28
-
29
-
30
-
31
-
32
-
33
-
34
-
35
-
36
-
37
-
38
-
39
-
40
-
41
-
42
-
43
-
44
-
45
-
46
-
47
-
48
-
49
-
50
-
51
-
52
-
53
-
54
-
55
-
56
-
57
-
58
-
59
-
60
-
61
-
62
-
63
-
 64
64 -
 65
65 -
 66
66 -
 67
67 -
 68
68 -
 69
69 -
 70
70 -
 71
71 -
 72
72 -
 73
73 -
 74
74 -
 75
75 -
 76
76 -
 77
77 -
 78
78 -
 79
79 -
 80
80 -
 81
81 -
 82
82 -
 83
83 -
 84
84 -
85
-
86
-
87
-
88
-
89
-
90
-
91
-
92
-
93
-
94
-
95
-
96
-
97
-
98
-
99
-
100
-
101
-
102
-
103
-
104
-
105
-
106
-
107
-
108
-
109
-
110
-
111
-
112
 |
 |

Management’s Discussion (Continued)
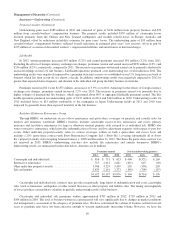
Insurance—Investment Income
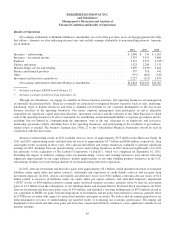
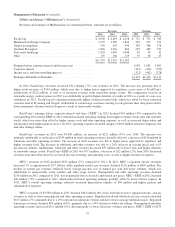
A summary of net investment income of our insurance operations follows. Amounts are in millions.
2012 2011 2010
Investment income before taxes and noncontrolling interests (1) .............................. $4,454 $4,725 $5,195
Income taxes and noncontrolling interests ............................................... 1,057 1,170 1,335
Net investment income .............................................................. $3,397 $3,555 $3,860
(1) Includes equity method earnings of $50 million in 2010 related to BNSF.
Investment income consists of interest and dividends earned on cash and investments of our insurance businesses. Pre-tax
investment income in 2012 declined $271 million (6%) compared to 2011. The decline reflected the redemptions in 2011 of our
investments in Goldman Sachs 10% Preferred Stock (insurance subsidiaries held 87% of the $5 billion aggregate investment)
and in General Electric 10% Preferred Stock ($3 billion aggregate investment). Dividends earned by our insurance subsidiaries
from these investments were $420 million in 2011. Investment income in 2012 reflected increased dividends earned from our
investment in Bank of America 6% Preferred Stock (insurance subsidiaries hold 80% of the $5 billion aggregate investment),
which was acquired in September of 2011, and increased dividend rates with respect to several of our common stock holdings.
We continue to hold significant cash and cash equivalent balances currently earning near zero yields. However, our
management believes that maintaining ample liquidity is paramount and strongly insists on safety over yield with respect to
cash and cash equivalents.
Pre-tax investment income in 2011 declined $470 million (9%) compared to 2010. Investment income in 2011 was
negatively impacted by redemptions at the end of 2010 and in 2011 of certain investments we made in 2008 and 2009, including
the aforementioned investments in Goldman Sachs and General Electric Preferred Stock, as well as the Swiss Re 12% capital
instrument (CHF 3 billion). Our insurance subsidiaries earned dividends from these three investments of $420 million in 2011
compared with approximately $1.0 billion in 2010. In 2011, investment income was favorably impacted by increased dividend
rates with respect to several of our common stock holdings.
Invested assets derive from shareholder capital and reinvested earnings as well as net liabilities under insurance contracts
or “float.” The major components of float are unpaid losses, life, annuity and health benefit liabilities, unearned premiums and
other liabilities to policyholders less premium and reinsurance receivables, deferred charges assumed under retroactive
reinsurance contracts and deferred policy acquisition costs. Float approximated $73 billion at December 31, 2012, $70 billion at
December 31, 2011 and $66 billion at December 31, 2010. The cost of float, as represented by the ratio of underwriting gain or
loss to average float, was negative for the last three years, as our insurance business generated underwriting gains in each year.
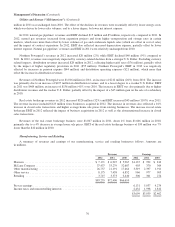
A summary of cash and investments held in our insurance businesses as of December 31, 2012 and 2011 follows. Other
investments include investments in Wrigley, Goldman Sachs, General Electric, Dow Chemical and Bank of America (See Note 5 to
the Consolidated Financial Statements). Amounts are in millions.
December 31,
2012 2011
Cash and cash equivalents ............................................................... $ 26,458 $ 21,571
Equity securities ...................................................................... 86,080 75,759
Fixed maturity securities ................................................................ 29,984 29,899
Other ............................................................................... 16,057 13,111
$158,579 $140,340
72