Berkshire Hathaway 2012 Annual Report Download - page 50
Download and view the complete annual report
Please find page 50 of the 2012 Berkshire Hathaway annual report below. You can navigate through the pages in the report by either clicking on the pages listed below, or by using the keyword search tool below to find specific information within the annual report.-
 1
1 -
2
-
3
-
4
-
5
-
6
-
7
-
8
-
9
-
10
-
11
-
12
-
13
-
14
-
15
-
16
-
17
-
18
-
19
-
20
-
21
-
22
-
23
-
24
-
25
-
26
-
27
-
28
-
29
-
30
-
31
-
32
-
33
-
34
-
35
-
36
-
37
-
38
-
39
-
 40
40 -
 41
41 -
 42
42 -
 43
43 -
 44
44 -
 45
45 -
 46
46 -
 47
47 -
 48
48 -
 49
49 -
 50
50 -
 51
51 -
 52
52 -
 53
53 -
 54
54 -
 55
55 -
 56
56 -
 57
57 -
 58
58 -
 59
59 -
 60
60 -
61
-
62
-
63
-
64
-
65
-
66
-
67
-
68
-
69
-
70
-
71
-
72
-
73
-
74
-
75
-
76
-
77
-
78
-
79
-
80
-
81
-
82
-
83
-
84
-
85
-
86
-
87
-
88
-
89
-
90
-
91
-
92
-
93
-
94
-
95
-
96
-
97
-
98
-
99
-
100
-
101
-
102
-
103
-
104
-
105
-
106
-
107
-
108
-
109
-
110
-
111
-
112
 |
 |

Notes to Consolidated Financial Statements (Continued)
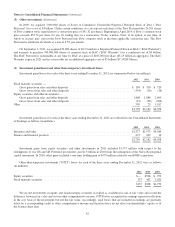
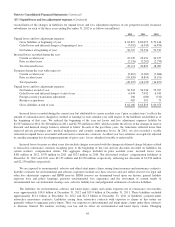
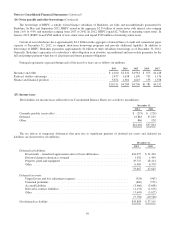
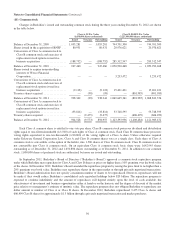
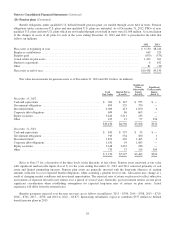
(13) Unpaid losses and loss adjustment expenses (Continued)
reconciliation of the changes in liabilities for unpaid losses and loss adjustment expenses of our property/casualty insurance
subsidiaries for each of the three years ending December 31, 2012 is as follows (in millions).
2012 2011 2010
Unpaid losses and loss adjustment expenses:
Gross liabilities at beginning of year .......................................... $63,819 $ 60,075 $ 59,416
Ceded losses and deferred charges at beginning of year ........................... (7,092) (6,545) (6,879)
Net balance at beginning of year ............................................. 56,727 53,530 52,537
Incurred losses recorded during the year:
Current accident year ...................................................... 22,239 23,031 20,357
Prior accident years ....................................................... (2,126) (2,202) (2,270)
Total incurred losses ...................................................... 20,113 20,829 18,087
Payments during the year with respect to:
Current accident year ...................................................... (9,667) (9,269) (7,666)
Prior accident years ....................................................... (10,628) (8,854) (9,191)
Total payments ........................................................... (20,295) (18,123) (16,857)
Unpaid losses and loss adjustment expenses:
Net balance at end of year .................................................. 56,545 56,236 53,767
Ceded losses and deferred charges at end of year ................................ 6,944 7,092 6,545
Foreign currency translation adjustment ....................................... 186 (100) (312)
Business acquisitions ...................................................... 485 591 75
Gross liabilities at end of year ............................................... $64,160 $ 63,819 $ 60,075
Incurred losses recorded during the current year but attributable to a prior accident year (“prior accident years”) reflects the
amount of estimation error charged or credited to earnings in each calendar year with respect to the liabilities established as of
the beginning of that year. We reduced the beginning of the year net losses and loss adjustment expenses liability by
$2,507 million in 2012, $2,780 million in 2011 and $2,793 million in 2010, which excludes the effects of the changes in reserve
discount and deferred charge balances referred to below. In each of the past three years, the reductions reflected lower than
expected private passenger auto, medical malpractice and casualty reinsurance losses. In 2011, we also recorded a sizable
reduction in unpaid losses associated with retroactive reinsurance contracts. Accident year loss estimates are regularly adjusted
to consider emerging loss development patterns of prior years’ losses, whether favorable or unfavorable.
Incurred losses for prior accident years also include charges associated with the changes in deferred charge balances related
to retroactive reinsurance contracts incepting prior to the beginning of the year and net discounts recorded on liabilities for
certain workers’ compensation claims. The aggregate charges included in prior accident years’ incurred losses were
$381 million in 2012, $578 million in 2011 and $523 million in 2010. Net discounted workers’ compensation liabilities at
December 31, 2012 and 2011 were $2,155 million and $2,250 million, respectively, reflecting net discounts of $1,990 million
and $2,130 million, respectively.
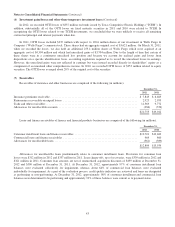
We are exposed to environmental, asbestos and other latent injury claims arising from insurance and reinsurance contracts.
Liability estimates for environmental and asbestos exposures include case basis reserves and also reflect reserves for legal and
other loss adjustment expenses and IBNR reserves. IBNR reserves are determined based upon our historic general liability
exposure base and policy language, previous environmental loss experience and the assessment of current trends of
environmental law, environmental cleanup costs, asbestos liability law and judgmental settlements of asbestos liabilities.
The liabilities for environmental, asbestos and latent injury claims and claims expenses net of reinsurance recoverables
were approximately $14.0 billion at December 31, 2012 and $13.9 billion at December 31, 2011. These liabilities included
approximately $12.4 billion at December 31, 2012 and $12.3 billion at December 31, 2011 of liabilities assumed under
retroactive reinsurance contracts. Liabilities arising from retroactive contracts with exposure to claims of this nature are
generally subject to aggregate policy limits. Thus, our exposure to environmental and latent injury claims under these contracts
is, likewise, limited. We monitor evolving case law and its effect on environmental and latent injury claims. Changing
48