Berkshire Hathaway 2012 Annual Report Download - page 75
Download and view the complete annual report
Please find page 75 of the 2012 Berkshire Hathaway annual report below. You can navigate through the pages in the report by either clicking on the pages listed below, or by using the keyword search tool below to find specific information within the annual report.-
 1
1 -
2
-
3
-
4
-
5
-
6
-
7
-
8
-
9
-
10
-
11
-
12
-
13
-
14
-
15
-
16
-
17
-
18
-
19
-
20
-
21
-
22
-
23
-
24
-
25
-
26
-
27
-
28
-
29
-
30
-
31
-
32
-
33
-
34
-
35
-
36
-
37
-
38
-
39
-
40
-
41
-
42
-
43
-
44
-
45
-
46
-
47
-
48
-
49
-
50
-
51
-
52
-
53
-
54
-
55
-
56
-
57
-
58
-
59
-
60
-
61
-
62
-
63
-
64
-
 65
65 -
 66
66 -
 67
67 -
 68
68 -
 69
69 -
 70
70 -
 71
71 -
 72
72 -
 73
73 -
 74
74 -
 75
75 -
 76
76 -
 77
77 -
 78
78 -
 79
79 -
 80
80 -
 81
81 -
 82
82 -
 83
83 -
 84
84 -
 85
85 -
86
-
87
-
88
-
89
-
90
-
91
-
92
-
93
-
94
-
95
-
96
-
97
-
98
-
99
-
100
-
101
-
102
-
103
-
104
-
105
-
106
-
107
-
108
-
109
-
110
-
111
-
112
 |
 |

Management’s Discussion (Continued)
Insurance—Investment Income (Continued)
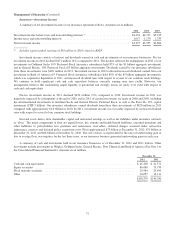
Fixed maturity investments as of December 31, 2012 were as follows. Amounts are in millions.
Amortized
cost
Unrealized
gains/losses
Fair
value
U.S. Treasury, U.S. government corporations and agencies ............................ $ 2,742 $ 33 $ 2,775
States, municipalities and political subdivisions ..................................... 2,735 178 2,913
Foreign governments .......................................................... 9,634 258 9,892
Corporate bonds, investment grade ............................................... 5,849 810 6,659
Corporate bonds, non-investment grade ........................................... 4,083 1,415 5,498
Mortgage-backed securities ..................................................... 1,981 266 2,247
$27,024 $2,960 $29,984
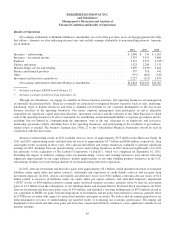
U.S. government obligations are rated AA+ or Aaa by the major rating agencies and approximately 86% of all state,
municipal and political subdivisions, foreign government obligations and mortgage-backed securities were rated AA or higher.
Non-investment grade securities represent securities that are rated below BBB- or Baa3. Foreign government securities include
obligations issued or unconditionally guaranteed by national or provincial government entities.
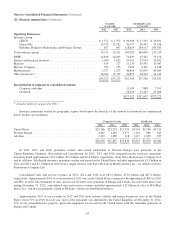
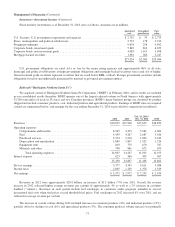
Railroad (“Burlington Northern Santa Fe”)
We acquired control of Burlington Northern Santa Fe Corporation (“BNSF”) in February 2010, and its results are included
in our consolidated results thereafter. BNSF operates one of the largest railroad systems in North America with approximately
32,500 route miles of track in 28 states and two Canadian provinces. BNSF’s major business groups are classified by product
shipped and include consumer products, coal, industrial products and agricultural products. Earnings of BNSF since we acquired
control are summarized below, and earnings for the year ending December 31, 2010 is provided for comparison (in millions).
2012 2011
Feb. 13, 2010 –
Dec. 31, 2010 2010
Revenues ......................................................... $20,835 $19,548 $15,059 $16,850
Operating expenses:
Compensation and benefits ....................................... 4,505 4,315 3,562 4,004
Fuel ......................................................... 4,459 4,267 2,687 3,016
Purchased services .............................................. 2,374 2,218 1,890 2,169
Depreciation and amortization ..................................... 1,889 1,807 1,532 1,724
Equipment rents ................................................ 810 779 670 767
Materials and other ............................................. 798 861 672 675
Total operating expenses ..................................... 14,835 14,247 11,013 12,355
Interest expense .................................................... 623 560 435 507
15,458 14,807 11,448 12,862
Pre-tax earnings .................................................... 5,377 4,741 3,611 3,988
Income taxes ...................................................... 2,005 1,769 1,376 1,529
Net earnings ....................................................... $ 3,372 $ 2,972 $ 2,235 $ 2,459
Revenues in 2012 were approximately $20.8 billion, an increase of $1.3 billion (7%) over 2011. Overall, the revenue
increase in 2012 reflected higher average revenues per car/unit of approximately 4% as well as a 2% increase in cars/units
handled (“volume”). Revenues in each period include fuel surcharges to customers under programs intended to recover
incremental fuel costs when fuel prices exceed threshold fuel prices. Fuel surcharges in 2012 increased 6% over 2011, and are
reflected in average revenue per car/unit.
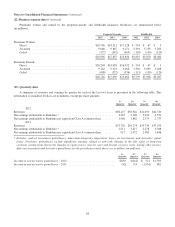
The increase in overall volume during 2012 included increases in consumer products (4%) and industrial products (13%),
partially offset by declines in coal (6%) and agricultural products (3%). The consumer products volume increase was primarily
73