Berkshire Hathaway 2012 Annual Report Download - page 44
Download and view the complete annual report
Please find page 44 of the 2012 Berkshire Hathaway annual report below. You can navigate through the pages in the report by either clicking on the pages listed below, or by using the keyword search tool below to find specific information within the annual report.-
 1
1 -
2
-
3
-
4
-
5
-
6
-
7
-
8
-
9
-
10
-
11
-
12
-
13
-
14
-
15
-
16
-
17
-
18
-
19
-
20
-
21
-
22
-
23
-
24
-
25
-
26
-
27
-
28
-
29
-
30
-
31
-
32
-
33
-
 34
34 -
 35
35 -
 36
36 -
 37
37 -
 38
38 -
 39
39 -
 40
40 -
 41
41 -
 42
42 -
 43
43 -
 44
44 -
 45
45 -
 46
46 -
 47
47 -
 48
48 -
 49
49 -
 50
50 -
 51
51 -
 52
52 -
 53
53 -
 54
54 -
55
-
56
-
57
-
58
-
59
-
60
-
61
-
62
-
63
-
64
-
65
-
66
-
67
-
68
-
69
-
70
-
71
-
72
-
73
-
74
-
75
-
76
-
77
-
78
-
79
-
80
-
81
-
82
-
83
-
84
-
85
-
86
-
87
-
88
-
89
-
90
-
91
-
92
-
93
-
94
-
95
-
96
-
97
-
98
-
99
-
100
-
101
-
102
-
103
-
104
-
105
-
106
-
107
-
108
-
109
-
110
-
111
-
112
 |
 |

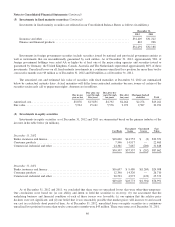
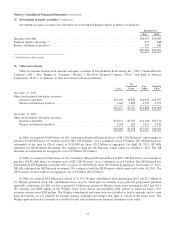
Notes to Consolidated Financial Statements (Continued)
(5) Other investments (Continued)
In 2009, we acquired 3,000,000 shares of Series A Cumulative Convertible Perpetual Preferred Stock of Dow (“Dow
Preferred”) for a cost of $3 billion. Under certain conditions, we can convert each share of the Dow Preferred into 24.201 shares
of Dow common stock (equivalent to a conversion price of $41.32 per share). Beginning in April 2014, if Dow’s common stock
price exceeds $53.72 per share for any 20 trading days in a consecutive 30-day window, Dow, at its option, at any time, in
whole or in part, may convert the Dow Preferred into Dow common stock at the then applicable conversion rate. The Dow
Preferred is entitled to dividends at a rate of 8.5% per annum.
On September 1, 2011, we acquired 50,000 shares of 6% Cumulative Perpetual Preferred Stock of BAC (“BAC Preferred”)
and warrants to purchase 700,000,000 shares of common stock of BAC (“BAC Warrants”) for a combined cost of $5 billion.
The BAC Preferred is redeemable at any time by BAC at a price of $105,000 per share ($5.25 billion in aggregate). The BAC
Warrants expire in 2021 and are exercisable for an additional aggregate cost of $5 billion ($7.142857/share).
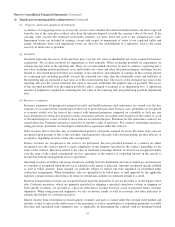
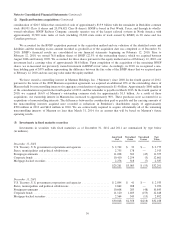
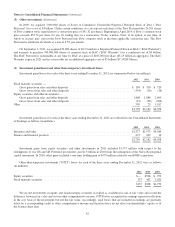
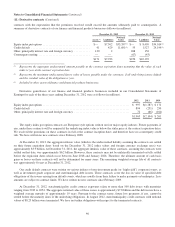
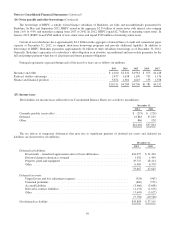
(6) Investment gains/losses and other-than-temporary investment losses
Investment gains/losses for each of the three years ending December 31, 2012 are summarized below (in millions).
2012 2011 2010
Fixed maturity securities —
Gross gains from sales and other disposals .......................................... $ 188 $ 310 $ 720
Gross losses from sales and other disposals .......................................... (354) (10) (16)
Equity securities and other investments —
Gross gains from sales and other disposals .......................................... 1,468 1,889 2,603
Gross losses from sales and other disposals .......................................... (12) (36) (266)
Other ............................................................................ 509 29 1,017
$1,799 $2,182 $4,058
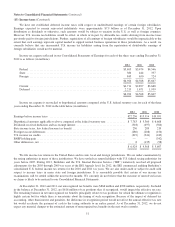
Investment gains/losses for each of the three years ending December 31, 2012 are reflected in our Consolidated Statements
of Earnings as follows (in millions).
2012 2011 2010
Insurance and other ................................................................ $1,327 $1,973 $4,044
Finance and financial products ........................................................ 472 209 14
$1,799 $2,182 $4,058
Investment gains from equity securities and other investments in 2011 included $1,775 million with respect to the
redemptions of our GS and GE Preferred investments and $1.3 billion in 2010 from the redemption of the Swiss Re perpetual
capital instrument. In 2010, other gains included a one-time holding gain of $979 million related to our BNSF acquisition.
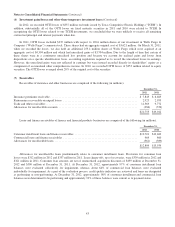
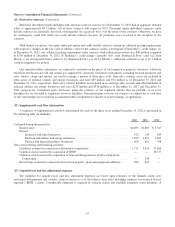
Other-than-temporary investment (“OTTI”) losses for each of the three years ending December 31, 2012 were as follows
(in millions).
2012 2011 2010
Equity securities ...................................................................... $— $506 $ 953
Fixed maturity securities ............................................................... 337 402 1,020
$337 $908 $1,973
We record investments in equity and fixed maturity securities classified as available-for-sale at fair value and record the
difference between fair value and cost in other comprehensive income. OTTI losses recognized in earnings represent reductions
in the cost basis of the investment, but not the fair value. Accordingly, such losses that are included in earnings are generally
offset by a corresponding credit to other comprehensive income and therefore have no net effect on shareholders’ equity as of
the balance sheet date.
42