Berkshire Hathaway 2012 Annual Report Download - page 80
Download and view the complete annual report
Please find page 80 of the 2012 Berkshire Hathaway annual report below. You can navigate through the pages in the report by either clicking on the pages listed below, or by using the keyword search tool below to find specific information within the annual report.-
 1
1 -
2
-
3
-
4
-
5
-
6
-
7
-
8
-
9
-
10
-
11
-
12
-
13
-
14
-
15
-
16
-
17
-
18
-
19
-
20
-
21
-
22
-
23
-
24
-
25
-
26
-
27
-
28
-
29
-
30
-
31
-
32
-
33
-
34
-
35
-
36
-
37
-
38
-
39
-
40
-
41
-
42
-
43
-
44
-
45
-
46
-
47
-
48
-
49
-
50
-
51
-
52
-
53
-
54
-
55
-
56
-
57
-
58
-
59
-
60
-
61
-
62
-
63
-
64
-
65
-
66
-
67
-
68
-
69
-
 70
70 -
 71
71 -
 72
72 -
 73
73 -
 74
74 -
 75
75 -
 76
76 -
 77
77 -
 78
78 -
 79
79 -
 80
80 -
 81
81 -
 82
82 -
 83
83 -
 84
84 -
 85
85 -
 86
86 -
 87
87 -
 88
88 -
 89
89 -
 90
90 -
91
-
92
-
93
-
94
-
95
-
96
-
97
-
98
-
99
-
100
-
101
-
102
-
103
-
104
-
105
-
106
-
107
-
108
-
109
-
110
-
111
-
112
 |
 |
Management’s Discussion (Continued)
Manufacturing, Service and Retailing (Continued)
McLane Company (Continued)
foodservice and beverage business units. The increases in grocery and foodservice revenues reflected manufacturer price
increases as well as increased volume. Pre-tax earnings in 2012 were $403 million, an increase of $33 million (9%) over 2011.
The overall increase in earnings reflected the increases in revenues as pre-tax margin rates were relatively unchanged.
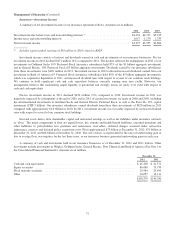
McLane’s revenues of $33.3 billion in 2011 increased approximately $600 million (2%) over 2010. The increase in
revenues in 2011 was partially attributable to the inclusion of the full-year results of Empire and Horizon. Otherwise, revenues
in 2011 from the grocery business were relatively unchanged from 2010, while revenues from the foodservice business
increased approximately 7% over 2010. Pre-tax earnings in 2011 were essentially unchanged from 2010 which reflected the
inclusion of Empire and Horizon and increased earnings from the grocery business, offset by lower earnings from the
foodservice business. In 2011, McLane benefitted from a slight increase in its consolidated gross sales margin, which was offset
by increased fuel, trucking and legal and professional costs.
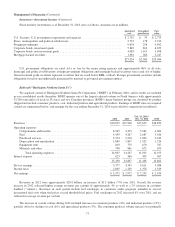
Other manufacturing
Our other manufacturing businesses include several manufacturers of building products (Acme Building Brands, Benjamin
Moore, Johns Manville, Shaw and MiTek) and apparel (led by Fruit of the Loom which includes Russell athletic apparel and
Vanity Fair Brands women’s intimate apparel). Also included in this group are Forest River, a leading manufacturer of leisure
vehicles, IMC Metalworking Companies (“Iscar”), an industry leader in the metal cutting tools business with operations
worldwide and CTB, a manufacturer of equipment and systems for the livestock and agricultural industries. Other
manufacturing businesses also include The Lubrizol Corporation (“Lubrizol”), a specialty chemical manufacturer that we
acquired on September 16, 2011. Lubrizol’s revenues and earnings are included in other manufacturing revenues and earnings
beginning as of that date.
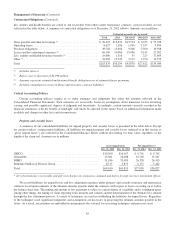
Revenues of our other manufacturing businesses in 2012 were approximately $26.8 billion, an increase of approximately
$5.6 billion (26%) over 2011. Excluding Lubrizol, revenues in 2012 grew 6% over 2011. In 2012, we experienced a revenue
increase of 27% from Forest River, which was attributable to increased volume and average sales prices. In 2012, revenues from
building products and apparel increased 4% and 5%, respectively, as compared with 2011. However, revenues in 2012 of Iscar
and CTB (before the impact of bolt-on acquisitions) declined compared to 2011 as a result of weakness in demand, particularly
in non-U.S. markets.
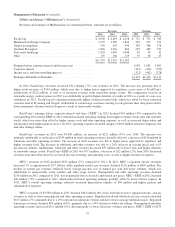
In 2012, pre-tax earnings of our other manufacturing businesses were approximately $3.3 billion, an increase of $922
million (38%) over earnings in 2011. Excluding the impact of Lubrizol, earnings of our other manufacturing businesses in 2012
increased 6% compared to 2011. The increase was primarily attributable to increased earnings from building products, apparel
and Forest River, partially offset by lower earnings from Iscar, CTB and Scott Fetzer. In 2012, our Shaw carpet and flooring
business benefited from the impact of price increases at the end of 2011 and beginning of 2012, as well as from relatively stable
raw material costs in 2012, that resulted in higher margins. Our apparel businesses benefitted from past pricing actions and
stabilizing raw material costs. On the other hand, our other businesses that manufacture products that are primarily for
commercial and industrial customers, particularly those with significant business in overseas markets, such as CTB and Iscar,
were negatively impacted in 2012 by slowing economic conditions in certain of those markets.
Other manufacturing revenues increased $3.5 billion (20%) in 2011 to $21.2 billion compared with 2010. In 2011, Lubrizol
accounted for approximately $1.7 billion of the increase. Otherwise, revenues of our other manufacturing businesses increased
10%. Iscar and CTB in particular experienced strong demand for their products.
Pre-tax earnings of our other manufacturing businesses were $2.4 billion in 2011, an increase of $486 million (25%) over
2010. Excluding the impact of Lubrizol, earnings increased 10% compared to 2010. Increased earnings were generated by Iscar
and CTB, which were partially offset by lower earnings of the apparel group and, particularly from the Fruit of the Loom group
of businesses, which were negatively impacted by significantly higher cotton costs. Our building products businesses were
negatively impacted by slow residential housing construction activity.
78