Berkshire Hathaway 2012 Annual Report Download - page 81
Download and view the complete annual report
Please find page 81 of the 2012 Berkshire Hathaway annual report below. You can navigate through the pages in the report by either clicking on the pages listed below, or by using the keyword search tool below to find specific information within the annual report.-
 1
1 -
2
-
3
-
4
-
5
-
6
-
7
-
8
-
9
-
10
-
11
-
12
-
13
-
14
-
15
-
16
-
17
-
18
-
19
-
20
-
21
-
22
-
23
-
24
-
25
-
26
-
27
-
28
-
29
-
30
-
31
-
32
-
33
-
34
-
35
-
36
-
37
-
38
-
39
-
40
-
41
-
42
-
43
-
44
-
45
-
46
-
47
-
48
-
49
-
50
-
51
-
52
-
53
-
54
-
55
-
56
-
57
-
58
-
59
-
60
-
61
-
62
-
63
-
64
-
65
-
66
-
67
-
68
-
69
-
70
-
 71
71 -
 72
72 -
 73
73 -
 74
74 -
 75
75 -
 76
76 -
 77
77 -
 78
78 -
 79
79 -
 80
80 -
 81
81 -
 82
82 -
 83
83 -
 84
84 -
 85
85 -
 86
86 -
 87
87 -
 88
88 -
 89
89 -
 90
90 -
 91
91 -
92
-
93
-
94
-
95
-
96
-
97
-
98
-
99
-
100
-
101
-
102
-
103
-
104
-
105
-
106
-
107
-
108
-
109
-
110
-
111
-
112
 |
 |
Management’s Discussion (Continued)
Manufacturing, Service and Retailing (Continued)
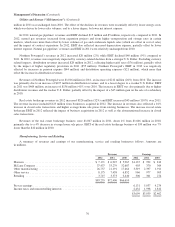
Other service
Our other service businesses include NetJets, the world’s leading provider of fractional ownership programs for general
aviation aircraft and FlightSafety, a provider of high technology training to operators of aircraft. Among the other businesses
included in this group are: TTI, a leading electronic components distributor; Business Wire, a leading distributor of corporate
news, multimedia and regulatory filings; Dairy Queen, which licenses and services a system of over 6,200 stores that offer
prepared dairy treats and food; Buffalo News and the BH Media Group, which includes the Omaha World-Herald acquired at
the end of 2011, as well as 26 other daily newspapers and numerous other publications; and businesses that provide
management and other services to insurance companies.
Revenues of our other service businesses in 2012 were approximately $8.2 billion, an increase of $737 million (10%) over
2011. The increase in revenues in 2012 was primarily attributable to the inclusion of the BH Media Group and a comparative
revenue increase from TTI, principally due to its bolt-on business acquisitions in 2012. Pre-tax earnings of $966 million in 2012
declined $11 million (1%) from earnings in 2011. Earnings of NetJets and FlightSafety in 2012 were relatively unchanged from
2011. Earnings of other service businesses in 2012 included earnings of the BH Media Group, which were more than offset by
lower earnings from TTI due primarily to weaker customer demand and intensifying price competition over the past year.
Revenues of our other service businesses were approximately $7.4 billion in 2011, an increase of $586 million (9%) over
2010. The revenue increase was primarily attributable to stronger demand for electronic components (TTI) and pilot training
(FlightSafety) and from higher revenues at NetJets. TTI revenues increased 12% as customer demand increased rapidly during
the first half of 2011, and then moderated over the second half. FlightSafety’s revenues increased approximately 8% due
primarily to increases in training demand within the business aviation and regional airline markets, partially offset by lower
revenues from government customers. The comparative revenue increases of NetJets reflected revenues related to aircraft
operating cost increases that are passed through to customers (with little or no margin), and slight increases in rates. Revenue
hours flown in 2011 were essentially unchanged from 2010.
Pre-tax earnings were $977 million in 2011, which exceeded 2010 by $72 million (8%). The increase in earnings was
driven by higher earnings of FlightSafety, NetJets and TTI, partially offset by lower earnings from Buffalo News. FlightSafety’s
earnings increased approximately 16%, reflecting increased revenues and ongoing cost containment efforts. NetJets’ earnings
increased 10% primarily attributable to higher revenues and lower aircraft maintenance costs due to a 10% reduction in the size
of the fleet, partially offset by comparatively higher impairment charges related to the planned disposition of certain aircraft and
fees incurred to cancel certain aircraft purchase commitments. Over the past few years, NetJets has reduced the number of
aircraft in its fleet by approximately 20% and lowered its operating cost structure to better match customer demand.
Retailing
Our retailing operations consist of four home furnishings businesses (Nebraska Furniture Mart, R.C. Willey, Star Furniture
and Jordan’s), three jewelry businesses (Borsheims, Helzberg and Ben Bridge), See’s Candies; Pampered Chef, a direct seller of
high quality kitchen tools; and Oriental Trading Company (“OTC”), a direct retailer of party supplies, school supplies and toys
and novelties, which we acquired on November 27, 2012.
Revenues and pre-tax earnings in 2012 from the retailing businesses increased $142 million (4%) and $5 million (2%),
respectively, over revenues and earnings in 2011. Increased revenues from the home furnishings and jewelry businesses as well
as the inclusion of OTC since November 27 were partially offset by lower revenues from Pampered Chef. Increased earnings of
our home furnishings retailers were substantially offset by lower earnings from our jewelry businesses and Pampered Chef.
Revenues of our retailing businesses were $3.6 billion in 2011, an increase of $133 million (4%) over 2010. Pre-tax
earnings were $301 million, an increase of $25 million (9%) over 2010. With the exception of Pampered Chef, each of our
retailing businesses generated comparatively higher revenues and pre-tax earnings in 2011.
79