Berkshire Hathaway 2012 Annual Report Download - page 65
Download and view the complete annual report
Please find page 65 of the 2012 Berkshire Hathaway annual report below. You can navigate through the pages in the report by either clicking on the pages listed below, or by using the keyword search tool below to find specific information within the annual report.-
 1
1 -
2
-
3
-
4
-
5
-
6
-
7
-
8
-
9
-
10
-
11
-
12
-
13
-
14
-
15
-
16
-
17
-
18
-
19
-
20
-
21
-
22
-
23
-
24
-
25
-
26
-
27
-
28
-
29
-
30
-
31
-
32
-
33
-
34
-
35
-
36
-
37
-
38
-
39
-
40
-
41
-
42
-
43
-
44
-
45
-
46
-
47
-
48
-
49
-
50
-
51
-
52
-
53
-
54
-
 55
55 -
 56
56 -
 57
57 -
 58
58 -
 59
59 -
 60
60 -
 61
61 -
 62
62 -
 63
63 -
 64
64 -
 65
65 -
 66
66 -
 67
67 -
 68
68 -
 69
69 -
 70
70 -
 71
71 -
 72
72 -
 73
73 -
 74
74 -
 75
75 -
76
-
77
-
78
-
79
-
80
-
81
-
82
-
83
-
84
-
85
-
86
-
87
-
88
-
89
-
90
-
91
-
92
-
93
-
94
-
95
-
96
-
97
-
98
-
99
-
100
-
101
-
102
-
103
-
104
-
105
-
106
-
107
-
108
-
109
-
110
-
111
-
112
 |
 |

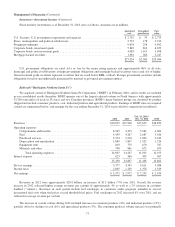
Notes to Consolidated Financial Statements (Continued)
(22) Business segment data (Continued)
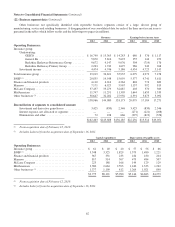
Goodwill
at year-end
Identifiable assets
at year-end
2012 2011 2012 2011 2010
Operating Businesses:
Insurance group:
GEICO ............................................... $ 1,372 $ 1,372 $ 30,986 $ 27,253 $ 25,631
General Re ............................................ 13,532 13,532 30,477 28,442 29,196
Berkshire Hathaway Reinsurance and Primary Groups .......... 607 607 118,819 104,913 104,383
Total insurance group ........................................ 15,511 15,511 180,282 160,608 159,210
BNSF .................................................... 14,836 14,803 56,839 55,282 53,476
Finance and financial products ................................. 1,036 1,032 24,412 23,919 24,692
Marmon .................................................. 814 727 11,230 10,597 10,047
McLane Company .......................................... 705 155 5,090 4,107 4,018
MidAmerican .............................................. 5,377 5,253 46,856 42,039 40,045
Other businesses * .......................................... 16,244 15,732 36,875 34,994 24,144
$54,523 $53,213 361,584 331,546 315,632
Reconciliation of segments to consolidated amount:
Corporate and other ..................................... 11,345 7,888 7,591
Goodwill .............................................. 54,523 53,213 49,006
$427,452 $392,647 $372,229
*Includes Lubrizol, acquired in 2011.
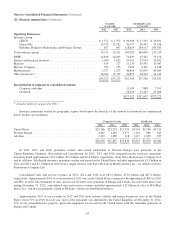
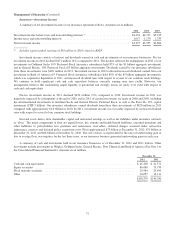
Insurance premiums written by geographic region (based upon the domicile of the insured or reinsured) are summarized
below. Dollars are in millions.
Property/Casualty Life/Health
2012 2011 2010 2012 2011 2010
United States ............................................ $23,186 $22,253 $21,539 $3,504 $3,100 $3,210
Western Europe .......................................... 4,387 4,495 3,377 1,114 880 945
All other ................................................ 2,319 1,089 918 1,217 1,090 927
$29,892 $27,837 $25,834 $5,835 $5,070 $5,082
In 2012, 2011 and 2010, premiums written and earned attributable to Western Europe were primarily in the
United Kingdom, Germany, Switzerland and Luxembourg. In 2012, 2011 and 2010, property/casualty insurance premiums
earned included approximately $3.4 billion, $2.9 billion and $2.4 billion, respectively, from Swiss Reinsurance Company Ltd.
and its affiliates. Life/health insurance premiums written and earned in the United States included approximately $1.5 billion in
2012 and 2011 and $2.1 billion in 2010 from a single contract with Swiss Re Life & Health America Inc., an affiliate of Swiss
Reinsurance Company Ltd.
Consolidated sales and service revenues in 2012, 2011 and 2010 were $83.3 billion, $72.8 billion and $67.2 billion,
respectively. Approximately 84% of such amounts in 2012 were in the United States compared with approximately 86% in 2011
and 88% in 2010. The remainder of sales and service revenues were primarily in Europe and Canada. In each of the three years
ending December 31, 2012, consolidated sales and service revenues included approximately $12 billion of sales to Wal-Mart
Stores, Inc., which were primarily related to McLane’s wholesale distribution business.
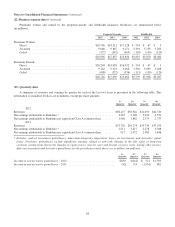
Approximately 96% of our revenues in 2012 and 2011 from railroad, utilities and energy businesses were in the United
States versus 97% in 2010. In each year, most of the remainder was attributed to the United Kingdom. At December 31, 2012,
91% of our consolidated net property, plant and equipment was located in the United States with the remainder primarily in
Europe and Canada.
63