Berkshire Hathaway 2012 Annual Report Download - page 82
Download and view the complete annual report
Please find page 82 of the 2012 Berkshire Hathaway annual report below. You can navigate through the pages in the report by either clicking on the pages listed below, or by using the keyword search tool below to find specific information within the annual report.-
 1
1 -
2
-
3
-
4
-
5
-
6
-
7
-
8
-
9
-
10
-
11
-
12
-
13
-
14
-
15
-
16
-
17
-
18
-
19
-
20
-
21
-
22
-
23
-
24
-
25
-
26
-
27
-
28
-
29
-
30
-
31
-
32
-
33
-
34
-
35
-
36
-
37
-
38
-
39
-
40
-
41
-
42
-
43
-
44
-
45
-
46
-
47
-
48
-
49
-
50
-
51
-
52
-
53
-
54
-
55
-
56
-
57
-
58
-
59
-
60
-
61
-
62
-
63
-
64
-
65
-
66
-
67
-
68
-
69
-
70
-
71
-
 72
72 -
 73
73 -
 74
74 -
 75
75 -
 76
76 -
 77
77 -
 78
78 -
 79
79 -
 80
80 -
 81
81 -
 82
82 -
 83
83 -
 84
84 -
 85
85 -
 86
86 -
 87
87 -
 88
88 -
 89
89 -
 90
90 -
 91
91 -
 92
92 -
93
-
94
-
95
-
96
-
97
-
98
-
99
-
100
-
101
-
102
-
103
-
104
-
105
-
106
-
107
-
108
-
109
-
110
-
111
-
112
 |
 |

Management’s Discussion (Continued)
Finance and Financial Products
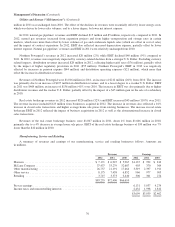
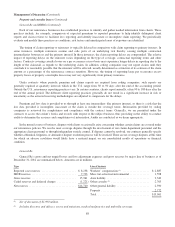
Our finance and financial products businesses include manufactured housing and finance (Clayton Homes), transportation
equipment leasing (XTRA), furniture leasing (CORT) as well as various miscellaneous financing activities. A summary of
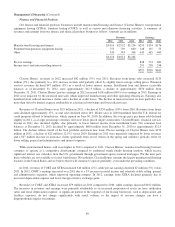
revenues and earnings from our finance and financial products businesses follows. Amounts are in millions.
Revenues Earnings
2012 2011 2010 2012 2011 2010
Manufactured housing and finance .................................. $3,014 $2,932 $3,256 $255 $154 $176
Furniture/transportation equipment leasing ............................ 753 739 660 148 155 53
Other .......................................................... 343 343 348 445 465 460
$4,110 $4,014 $4,264
Pre-tax earnings ................................................. 848 774 689
Income taxes and noncontrolling interests ............................. 291 258 248
$557 $516 $441
Clayton Homes’ revenues in 2012 increased $82 million (3%) over 2011. Revenues from home sales increased $129
million (9%), due primarily to a 14% increase in units sold partially offset by slightly lower average selling prices. Financial
services revenues declined $47 million (3%) as a result of lower interest income. Installment loan and finance receivable
balances as of December 31, 2012, were approximately $12.3 billion, a decline of approximately $550 million from
December 31, 2011. Clayton Homes’ pre-tax earnings in 2012 increased $101 million (66%) over earnings in 2011. Earnings in
2012 were impacted by the increased unit sales which improved manufacturing and other operating efficiencies. Earnings also
benefited from reduced insurance claims and a decline in credit losses. The decline in interest income on loan portfolios was
more than offset by interest expense attributable to a decline in borrowings and lower interest rates.
Revenues of Clayton Homes were $2.9 billion in 2011, a decline of $324 million (10%) from 2010. Revenues from home
sales declined approximately 17%, as unit sales declined about 14%. Home sales in 2010 benefitted from the U.S. federal tax
credit program offered to homebuyers, which expired on June 30, 2010. In addition, the average price per home sold declined
slightly in 2011, as a larger percentage of homes sold were lower priced single section units. Clayton Homes’ financial services
income in 2011 also declined slightly, due primarily to lower interest income from installment loans. Net consumer loan
balances at December 31, 2011 declined by approximately $600 million from December 31, 2010 to approximately $12.9
billion. The decline reflects runoff of the loan portfolio and fewer new loans. Pre-tax earnings of Clayton Homes were $154
million in 2011, a decline of $22 million (12.5%) versus 2010. Earnings in 2011 were negatively impacted by lower revenues
and a $27 million increase in insurance claims (primarily from severe storms in the spring and summer), partially offset by
lower selling, general and administrative and interest expenses.
While manufactured homes sold were higher in 2012 compared to 2011, Clayton Homes’ manufactured housing business
continues to operate at a competitive disadvantage compared to traditional single family housing markets, which receive
significant interest rate subsidies from the U.S. government through government agency insured mortgages. For the most part,
these subsidies are not available to factory built homes. Nevertheless, Clayton Homes remains the largest manufactured housing
business in the United States and we believe that it will continue to operate profitably, even under the prevailing conditions.
In 2012, revenues of CORT and XTRA increased $14 million (2%), while pre-tax earnings declined $7 million (5%) versus
2011. In 2012, CORT’s earnings increased over 2011 due to a 5% increase in rental income and relatively stable selling, general
and administrative expenses, which improved operating margins. In 2012, earnings from XTRA declined primarily due to
increased depreciation expense and lower foreign currency exchange gains.
Revenues of CORT and XTRA increased $79 million in 2011 compared to 2010, while earnings increased $102 million.
The increases in revenues and earnings were primarily attributable to an increased proportion of assets on lease (utilization
rates) and lower depreciation expense. A significant portion of the expenses of our leasing businesses, such as depreciation and
facilities expenses, do not change significantly with rental volume, so the impact of revenue changes can have a
disproportionate impact on earnings.
80