Wells Fargo 2012 Annual Report Download - page 94
Download and view the complete annual report
Please find page 94 of the 2012 Wells Fargo annual report below. You can navigate through the pages in the report by either clicking on the pages listed below, or by using the keyword search tool below to find specific information within the annual report.-
 1
1 -
2
-
3
-
4
-
5
-
6
-
7
-
8
-
9
-
10
-
11
-
12
-
13
-
14
-
15
-
16
-
17
-
18
-
19
-
20
-
21
-
22
-
23
-
24
-
25
-
26
-
27
-
28
-
29
-
30
-
31
-
32
-
33
-
34
-
35
-
36
-
37
-
38
-
39
-
40
-
41
-
42
-
43
-
44
-
45
-
46
-
47
-
48
-
49
-
50
-
51
-
52
-
53
-
54
-
55
-
56
-
57
-
58
-
59
-
60
-
61
-
62
-
63
-
64
-
65
-
66
-
67
-
68
-
69
-
70
-
71
-
72
-
73
-
74
-
75
-
76
-
77
-
78
-
79
-
80
-
81
-
82
-
83
-
 84
84 -
 85
85 -
 86
86 -
 87
87 -
 88
88 -
 89
89 -
 90
90 -
 91
91 -
 92
92 -
 93
93 -
 94
94 -
 95
95 -
 96
96 -
 97
97 -
 98
98 -
 99
99 -
 100
100 -
 101
101 -
 102
102 -
 103
103 -
 104
104 -
105
-
106
-
107
-
108
-
109
-
110
-
111
-
112
-
113
-
114
-
115
-
116
-
117
-
118
-
119
-
120
-
121
-
122
-
123
-
124
-
125
-
126
-
127
-
128
-
129
-
130
-
131
-
132
-
133
-
134
-
135
-
136
-
137
-
138
-
139
-
140
-
141
-
142
-
143
-
144
-
145
-
146
-
147
-
148
-
149
-
150
-
151
-
152
-
153
-
154
-
155
-
156
-
157
-
158
-
159
-
160
-
161
-
162
-
163
-
164
-
165
-
166
-
167
-
168
-
169
-
170
-
171
-
172
-
173
-
174
-
175
-
176
-
177
-
178
-
179
-
180
-
181
-
182
-
183
-
184
-
185
-
186
-
187
-
188
-
189
-
190
-
191
-
192
-
193
-
194
-
195
-
196
-
197
-
198
-
199
-
200
-
201
-
202
-
203
-
204
-
205
-
206
-
207
-
208
-
209
-
210
-
211
-
212
-
213
-
214
-
215
-
216
-
217
-
218
-
219
-
220
-
221
-
222
-
223
-
224
-
225
-
226
-
227
-
228
-
229
-
230
-
231
-
232
-
233
-
234
-
235
-
236
-
237
-
238
-
239
-
240
-
241
-
242
-
243
-
244
-
245
-
246
-
247
-
248
-
249
-
250
-
251
-
252
 |
 |
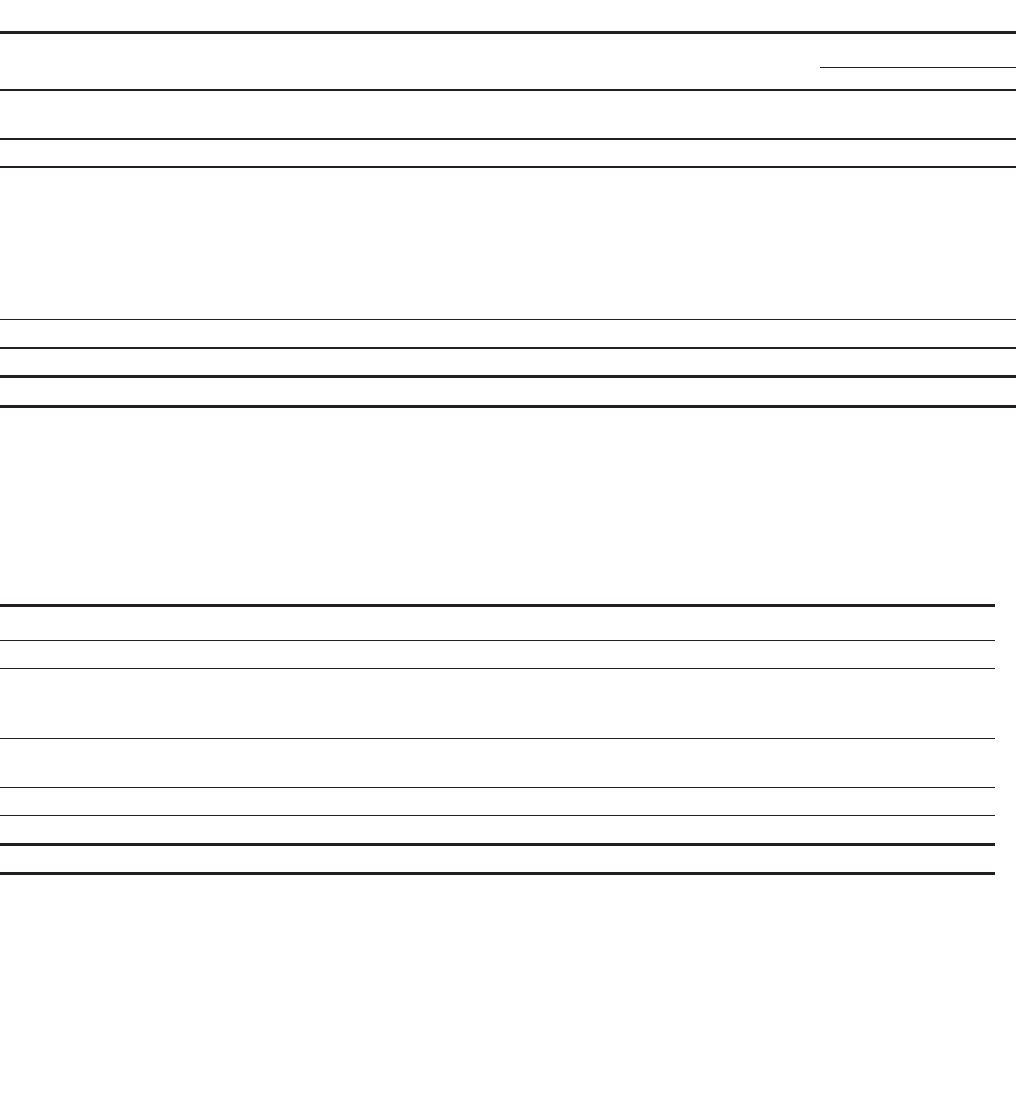
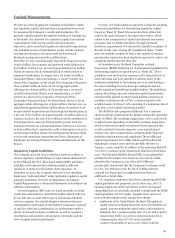
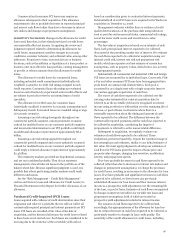
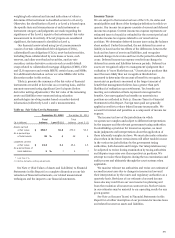
Capital Management (continued)
Table 49: Tier 1 Common Equity Under Basel I (1)
December 31,
(in billions) 2012 2011
Total equity $ 158.9 141.7
Noncontrolling interests (1.3) (1.5)
Total Wells Fargo stockholders' equity 157.6 140.2
Adjustments:
Preferred equity (12.0) (10.6)
Goodwill and intangible assets (other than MSRs) (32.9) (34.0)
Applicable deferred taxes 3.2 3.8
MSRs over specified limitations (0.7) (0.8)
Cumulative other comprehensive income (5.6) (3.1)
Other (0.6) (0.4)
Tier 1 common equity (A) $ 109.0 95.1
Total risk-weighted assets (2) (B) $ 1,077.1 1,005.6
Tier 1 common equity to total risk-weighted assets (2) (A)/(B) 10.12 % 9.46
(1)
Tier 1 common equity is a non-GAAP financial measure that is used by investors, analysts and bank regulatory agencies to assess the capital position of financial services
companies. Management reviews Tier 1 common equity along with other measures of capital as part of its financial analyses and has included this non-GAAP financial
information, and the corresponding reconciliation to total equity, because of current interest in such information on the part of market participants.
(2) Under the regulatory guidelines for risk-based capital, on-balance sheet assets and credit equivalent amounts of derivatives and off-balance sheet items are assigned to one
of several broad risk categories according to the obligor or, if relevant, the guarantor or the nature of any collateral. The aggregate dollar amount in each risk category is
then multiplied by the risk weight associated with that category. The resulting weighted values from each of the risk categories are aggregated for determining total risk-
weighted assets. Effective September 30, 2012, the Company refined its determination of the risk weighting of certain unused lending commitments that provide for the
ability to issue standby letters of credit and commitments to issue standby letters of credit under syndication arrangements where the Company has an obligation to issue in
a lead agent or similar capacity beyond its contractual participation level.
Table 50: Tier 1 Common Equity Under Basel III (Estimated) (1) (2)
(in billions) December 31, 2012
Tier 1 common equity under Basel I $ 109.0
Adjustments from Basel I to Basel III (3) (5):
Cumulative other comprehensive income related to AFS securities and defined benefit pension plans 5.3
Other 0.4
Total adjustments from Basel I to Basel III 5.7
Threshold deductions, as defined under Basel III (4) (5) (0.9)
Tier 1 common equity anticipated under Basel III (C) $ 113.8
Total risk-weighted assets anticipated under Basel III (6) (D) $ 1,389.2
Tier 1 common equity to total risk-weighted assets anticipated under Basel III (C)/(D) 8.19 %
(1) Tier 1 common equity is a non-GAAP financial measure that is used by investors, analysts and bank regulatory agencies to assess the capital position of financial services
companies. Management reviews Tier 1 common equity along with other measures of capital as part of its financial analyses and has included this non-GAAP financial
information, and the corresponding reconciliation to total equity, because of current interest in such information on the part of market participants.
(2) The Basel III Tier 1 common equity and risk-weighted assets are calculated based on management’s current interpretation of the Basel III capital rules proposed by
federal banking agencies in notices of proposed rulemaking announced in June 2012. The proposed rules and interpretations and assumptions used in estimating Basel III
calculations are subject to change depending on final promulgations of Basel III capital rules.
(3) Adjustments from Basel I to Basel III represent reconciling adjustments, primarily certain components of cumulative other comprehensive income deducted for Basel I
purposes, to derive Tier 1 common equity under Basel III.
(4) Threshold deductions, as defined under Basel III, include individual and aggregate limitations, as a percentage of Tier 1 common equity, with respect to MSRs, deferred
tax assets and investments in unconsolidated financial com
p
anies.
(5) Volatility in interest rates can have a significant impact on the valuation of cumulative other comprehensive income and MSRs and therefore, may impact adjustments
from Basel I to Basel III, and MSRs subject to threshold deductions, as defined under Basel III, in future reporting periods.
(6) Under current Basel proposals, risk-weighted assets incorporate different classifications of assets, with certain risk weights based on a borrower's credit rating or Wells
Fargo's own risk models, along with adjustments to address a combination of credit/counterparty, operational and market risks, and other Basel III elements. The
amount of risk-weighted assets anticipated under Basel III is preliminary and subject to change depending on final promulgation of Basel III capital rulemaking and
interpretations thereof by regulatory authorities.
92