Wells Fargo 2012 Annual Report Download - page 61
Download and view the complete annual report
Please find page 61 of the 2012 Wells Fargo annual report below. You can navigate through the pages in the report by either clicking on the pages listed below, or by using the keyword search tool below to find specific information within the annual report.-
 1
1 -
2
-
3
-
4
-
5
-
6
-
7
-
8
-
9
-
10
-
11
-
12
-
13
-
14
-
15
-
16
-
17
-
18
-
19
-
20
-
21
-
22
-
23
-
24
-
25
-
26
-
27
-
28
-
29
-
30
-
31
-
32
-
33
-
34
-
35
-
36
-
37
-
38
-
39
-
40
-
41
-
42
-
43
-
44
-
45
-
46
-
47
-
48
-
49
-
50
-
 51
51 -
 52
52 -
 53
53 -
 54
54 -
 55
55 -
 56
56 -
 57
57 -
 58
58 -
 59
59 -
 60
60 -
 61
61 -
 62
62 -
 63
63 -
 64
64 -
 65
65 -
 66
66 -
 67
67 -
 68
68 -
 69
69 -
 70
70 -
 71
71 -
72
-
73
-
74
-
75
-
76
-
77
-
78
-
79
-
80
-
81
-
82
-
83
-
84
-
85
-
86
-
87
-
88
-
89
-
90
-
91
-
92
-
93
-
94
-
95
-
96
-
97
-
98
-
99
-
100
-
101
-
102
-
103
-
104
-
105
-
106
-
107
-
108
-
109
-
110
-
111
-
112
-
113
-
114
-
115
-
116
-
117
-
118
-
119
-
120
-
121
-
122
-
123
-
124
-
125
-
126
-
127
-
128
-
129
-
130
-
131
-
132
-
133
-
134
-
135
-
136
-
137
-
138
-
139
-
140
-
141
-
142
-
143
-
144
-
145
-
146
-
147
-
148
-
149
-
150
-
151
-
152
-
153
-
154
-
155
-
156
-
157
-
158
-
159
-
160
-
161
-
162
-
163
-
164
-
165
-
166
-
167
-
168
-
169
-
170
-
171
-
172
-
173
-
174
-
175
-
176
-
177
-
178
-
179
-
180
-
181
-
182
-
183
-
184
-
185
-
186
-
187
-
188
-
189
-
190
-
191
-
192
-
193
-
194
-
195
-
196
-
197
-
198
-
199
-
200
-
201
-
202
-
203
-
204
-
205
-
206
-
207
-
208
-
209
-
210
-
211
-
212
-
213
-
214
-
215
-
216
-
217
-
218
-
219
-
220
-
221
-
222
-
223
-
224
-
225
-
226
-
227
-
228
-
229
-
230
-
231
-
232
-
233
-
234
-
235
-
236
-
237
-
238
-
239
-
240
-
241
-
242
-
243
-
244
-
245
-
246
-
247
-
248
-
249
-
250
-
251
-
252
 |
 |

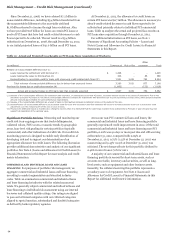
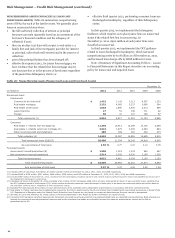
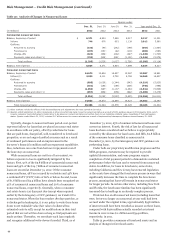
frequency and severity of loss. In first quarter 2012, in
accordance with Interagency Supervisory Guidance on
Allowance for Loan and Lease Losses Estimation Practices for
Loans and Lines of Credit Secured by Junior Liens on 1-4
Family Residential Properties issued by bank regulators on
January 31, 2012 (Interagency Guidance), we aligned our
nonaccrual reporting so that a junior lien is reported as a
nonaccrual loan if the related first lien is 120 days past due or is
in the process of foreclosure regardless of the junior lien
delinquency status. This action had minimal financial impact as
the expected loss content of these loans was already considered
in the allowance for loan losses. At December 31, 2012,
$960 million of performing junior liens subordinate to
delinquent senior liens were classified as nonaccrual. For
additional information, see Note 1 (Summary of Significant
Accounting Policies) to Financial Statements in this Report.
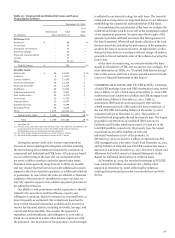
In addition, credit metrics for 2012 were affected by the
guidance in the Office of the Comptroller of the Currency (OCC)
update to the Bank Accounting Advisory Series (OCC guidance)
issued in third quarter 2012, which requires consumer loans
discharged in bankruptcy to be written down to net realizable
collateral value and classified as nonaccrual TDRs, regardless of
their delinquency status. At December 31, 2012, $1.8 billion of
the loans affected were classified as nonaccrual and $5.2 billion
were reported as TDRs. The OCC guidance also increased
charge-offs by $888 million in 2012. Loans affected were
predominantly real estate 1-4 family mortgage loans.
See the “Risk Management – Credit Risk Management –
Nonperforming Assets” section in this Report for more
information.
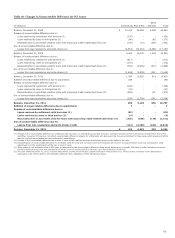
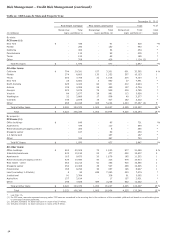
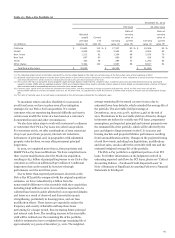
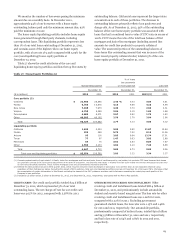
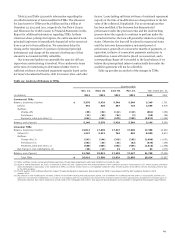
Table 23: Real Estate 1-4 Family First and Junior Lien
Mortgage Loans by State
December 31, 2012
Real estate Real estate Total real
1-4 family 1-4 family estate 1-4 % of
first junior lien family total
(in millions) mortgage mortgage mortgage loans
PCI loans:
California $ 17,372 33 17,405 2 %
Florida 2,383 26 2,409 *
New Jersey 1,254 19 1,273 *
Other (1) 5,830 74 5,904 *
Total PCI loans $ 26,839 152 26,991 3 %
All other loans:
California $ 64,466 21,017 85,483 11 %
Florida 15,509 6,752 22,261 3
New Jersey 9,731 5,646 15,377 2
New York 11,574 3,214 14,788 2
Virginia 6,742 3,944 10,686 1
Pennsylvania 6,072 3,519 9,591 1
North Carolina 6,050 3,180 9,230 1
Texas 7,528 1,115 8,643 1
Georgia 4,869 2,958 7,827 1
Other (2) 60,801 23,968 84,769 11
Government insured/
guaranteed loans (3) 29,719 - 29,719 4
Total all
other loans $ 223,061 75,313 298,374 38 %
Total $ 249,900 75,465 325,365 41 %
* Less than 1%.
(1) Consists of 45 states; no state had loans in excess of $710 million.
(2) Consists of 41 states; no state had loans in excess of $7.0 billion.
(3) Represents loans whose repayments are predominantly insured by the FHA or
guaranteed by the VA.
59