Wells Fargo 2012 Annual Report Download - page 246
Download and view the complete annual report
Please find page 246 of the 2012 Wells Fargo annual report below. You can navigate through the pages in the report by either clicking on the pages listed below, or by using the keyword search tool below to find specific information within the annual report.-
 1
1 -
2
-
3
-
4
-
5
-
6
-
7
-
8
-
9
-
10
-
11
-
12
-
13
-
14
-
15
-
16
-
17
-
18
-
19
-
20
-
21
-
22
-
23
-
24
-
25
-
26
-
27
-
28
-
29
-
30
-
31
-
32
-
33
-
34
-
35
-
36
-
37
-
38
-
39
-
40
-
41
-
42
-
43
-
44
-
45
-
46
-
47
-
48
-
49
-
50
-
51
-
52
-
53
-
54
-
55
-
56
-
57
-
58
-
59
-
60
-
61
-
62
-
63
-
64
-
65
-
66
-
67
-
68
-
69
-
70
-
71
-
72
-
73
-
74
-
75
-
76
-
77
-
78
-
79
-
80
-
81
-
82
-
83
-
84
-
85
-
86
-
87
-
88
-
89
-
90
-
91
-
92
-
93
-
94
-
95
-
96
-
97
-
98
-
99
-
100
-
101
-
102
-
103
-
104
-
105
-
106
-
107
-
108
-
109
-
110
-
111
-
112
-
113
-
114
-
115
-
116
-
117
-
118
-
119
-
120
-
121
-
122
-
123
-
124
-
125
-
126
-
127
-
128
-
129
-
130
-
131
-
132
-
133
-
134
-
135
-
136
-
137
-
138
-
139
-
140
-
141
-
142
-
143
-
144
-
145
-
146
-
147
-
148
-
149
-
150
-
151
-
152
-
153
-
154
-
155
-
156
-
157
-
158
-
159
-
160
-
161
-
162
-
163
-
164
-
165
-
166
-
167
-
168
-
169
-
170
-
171
-
172
-
173
-
174
-
175
-
176
-
177
-
178
-
179
-
180
-
181
-
182
-
183
-
184
-
185
-
186
-
187
-
188
-
189
-
190
-
191
-
192
-
193
-
194
-
195
-
196
-
197
-
198
-
199
-
200
-
201
-
202
-
203
-
204
-
205
-
206
-
207
-
208
-
209
-
210
-
211
-
212
-
213
-
214
-
215
-
216
-
217
-
218
-
219
-
220
-
221
-
222
-
223
-
224
-
225
-
226
-
227
-
228
-
229
-
230
-
231
-
232
-
233
-
234
-
235
-
 236
236 -
 237
237 -
 238
238 -
 239
239 -
 240
240 -
 241
241 -
 242
242 -
 243
243 -
 244
244 -
 245
245 -
 246
246 -
 247
247 -
 248
248 -
 249
249 -
 250
250 -
 251
251 -
 252
252
 |
 |

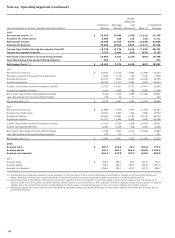
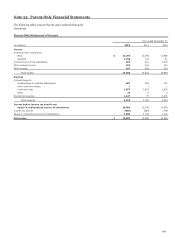
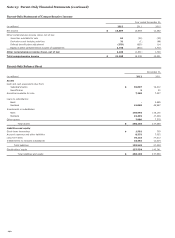
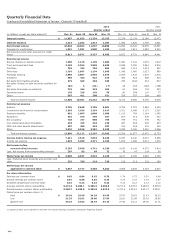
Quarterly Financial Data
Condensed Consolidated Statement of Income - Quarterly (Unaudited)
2012 2011
Quarter ended Quarter ended
(in millions, except per share amounts) Dec. 31 Sept. 30 June 30 Mar. 31 Dec. 31 Sept. 30 June 30 Mar. 31
Interest income $ 11,857 11,925 12,354 12,255 12,378 12,178 12,384 12,472
Interest expense 1,214 1,263 1,317 1,367 1,486 1,636 1,706 1,821
Net interest income 10,643 10,662 11,037 10,888 10,892 10,542 10,678 10,651
Provision for credit losses 1,831 1,591 1,800 1,995 2,040 1,811 1,838 2,210
Net interest income after provision for credit
losses 8,812 9,071 9,237 8,893 8,852 8,731 8,840 8,441
Noninterest income
Service charges on deposit accounts 1,250 1,210 1,139 1,084 1,091 1,103 1,074 1,012
Trust and investment fees 3,199 2,954 2,898 2,839 2,658 2,786 2,944 2,916
Card fees 736 744 704 654 680 1,013 1,003 957
Other fees 1,193 1,097 1,134 1,095 1,096 1,085 1,023 989
Mortgage banking 3,068 2,807 2,893 2,870 2,364 1,833 1,619 2,016
Insurance 395 414 522 519 466 423 568 503
Net gains from trading activities 275 529 263 640 430 (442) 414 612
Net gains (losses) on debt securities available for
sale (63) 3 (61) (7) 48 300 (128) (166)
Net gains from equity investments 715 164 242 364 61 344 724 353
Operating leases 170 218 120 59 60 284 103 77
Other 367 411 398 631 759 357 364 409
Total noninterest income 11,305 10,551 10,252 10,748 9,713 9,086 9,708 9,678
Noninterest expense
Salaries 3,735 3,648 3,705 3,601 3,706 3,718 3,584 3,454
Commission and incentive compensation 2,365 2,368 2,354 2,417 2,251 2,088 2,171 2,347
Employee benefits 891 1,063 1,049 1,608 1,012 780 1,164 1,392
Equipment 542 510 459 557 607 516 528 632
Net occupancy 728 727 698 704 759 751 749 752
Core deposit and other intangibles 418 419 418 419 467 466 464 483
FDIC and other deposit assessments 307 359 333 357 314 332 315 305
Other 3,910 3,018 3,381 3,330 3,392 3,026 3,500 3,368
Total noninterest expense 12,896 12,112 12,397 12,993 12,508 11,677 12,475 12,733
Income before income tax expense 7,221 7,510 7,092 6,648 6,057 6,140 6,073 5,386
Income tax expense 1,924 2,480 2,371 2,328 1,874 1,998 2,001 1,572
Net income before
noncontrolling interests 5,297 5,030 4,721 4,320 4,183 4,142 4,072 3,814
Less: Net income from noncontrolling interests 207 93 99 72 76 87 124 55
Wells Fargo net income $ 5,090 4,937 4,622 4,248 4,107 4,055 3,948 3,759
Less: Preferred stock dividends and accretion and
other 233 220 219 226 219 216 220 189
Wells Fargo net income
applicable to common stock $ 4,857 4,717 4,403 4,022 3,888 3,839 3,728 3,570
Per share information
Earnings per common share $ 0.92 0.89 0.83 0.76 0.74 0.73 0.70 0.68
Diluted earnings per common share 0.91 0.88 0.82 0.75 0.73 0.72 0.70 0.67
Dividends declared per common share 0.22 0.22 0.22 0.22 0.12 0.12 0.12 0.12
Average common shares outstanding 5,272.4 5,288.1 5,306.9 5,282.6 5,271.9 5,275.5 5,286.5 5,278.8
Diluted average common shares outstanding 5,338.7 5,355.6 5,369.9 5,337.8 5,317.6 5,319.2 5,331.7 5,333.1
Market price per common share (1)
High $ 36.34 36.60 34.59 34.59 27.97 29.63 32.63 34.25
Low 31.25 32.62 29.80 27.94 22.61 22.58 25.26 29.82
Quarter-end 34.18 34.53 33.44 34.14 27.56 24.12 28.06 31.71
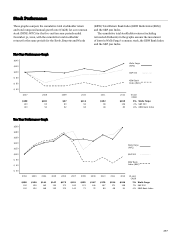
(1) Based on daily prices reported on the New York Stock Exchange Composite Transaction Reporting System.
244