Wells Fargo 2012 Annual Report Download - page 221
Download and view the complete annual report
Please find page 221 of the 2012 Wells Fargo annual report below. You can navigate through the pages in the report by either clicking on the pages listed below, or by using the keyword search tool below to find specific information within the annual report.-
 1
1 -
2
-
3
-
4
-
5
-
6
-
7
-
8
-
9
-
10
-
11
-
12
-
13
-
14
-
15
-
16
-
17
-
18
-
19
-
20
-
21
-
22
-
23
-
24
-
25
-
26
-
27
-
28
-
29
-
30
-
31
-
32
-
33
-
34
-
35
-
36
-
37
-
38
-
39
-
40
-
41
-
42
-
43
-
44
-
45
-
46
-
47
-
48
-
49
-
50
-
51
-
52
-
53
-
54
-
55
-
56
-
57
-
58
-
59
-
60
-
61
-
62
-
63
-
64
-
65
-
66
-
67
-
68
-
69
-
70
-
71
-
72
-
73
-
74
-
75
-
76
-
77
-
78
-
79
-
80
-
81
-
82
-
83
-
84
-
85
-
86
-
87
-
88
-
89
-
90
-
91
-
92
-
93
-
94
-
95
-
96
-
97
-
98
-
99
-
100
-
101
-
102
-
103
-
104
-
105
-
106
-
107
-
108
-
109
-
110
-
111
-
112
-
113
-
114
-
115
-
116
-
117
-
118
-
119
-
120
-
121
-
122
-
123
-
124
-
125
-
126
-
127
-
128
-
129
-
130
-
131
-
132
-
133
-
134
-
135
-
136
-
137
-
138
-
139
-
140
-
141
-
142
-
143
-
144
-
145
-
146
-
147
-
148
-
149
-
150
-
151
-
152
-
153
-
154
-
155
-
156
-
157
-
158
-
159
-
160
-
161
-
162
-
163
-
164
-
165
-
166
-
167
-
168
-
169
-
170
-
171
-
172
-
173
-
174
-
175
-
176
-
177
-
178
-
179
-
180
-
181
-
182
-
183
-
184
-
185
-
186
-
187
-
188
-
189
-
190
-
191
-
192
-
193
-
194
-
195
-
196
-
197
-
198
-
199
-
200
-
201
-
202
-
203
-
204
-
205
-
206
-
207
-
208
-
209
-
210
-
 211
211 -
 212
212 -
 213
213 -
 214
214 -
 215
215 -
 216
216 -
 217
217 -
 218
218 -
 219
219 -
 220
220 -
 221
221 -
 222
222 -
 223
223 -
 224
224 -
 225
225 -
 226
226 -
 227
227 -
 228
228 -
 229
229 -
 230
230 -
 231
231 -
232
-
233
-
234
-
235
-
236
-
237
-
238
-
239
-
240
-
241
-
242
-
243
-
244
-
245
-
246
-
247
-
248
-
249
-
250
-
251
-
252
 |
 |

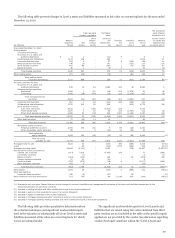
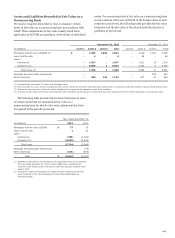
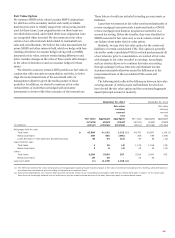
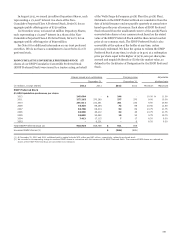
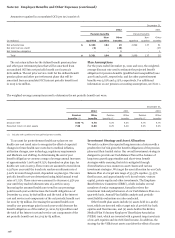
Disclosures about Fair Value of Financial Instruments
The table below is a summary of fair value estimates for financial
instruments, excluding financial instruments recorded at fair
value on a recurring basis as they are included within the Assets
and Liabilities Recorded at Fair Value on a Recurring Basis table
included earlier in this Note. The carrying amounts in the
following table are recorded in the balance sheet under the
indicated captions.
We have not included assets and liabilities that are not
financial instruments in our disclosure, such as the value of the
long-term relationships with our deposit, credit card and trust
customers, amortized MSRs, premises and equipment, goodwill
and other intangibles, deferred taxes and other liabilities. The
total of the fair value calculations presented does not represent,
and should not be construed to represent, the underlying value
of the Company.
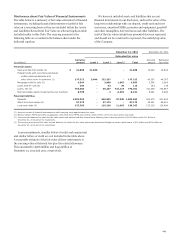
December 31, 2012 December 31, 2011
Estimated fair value
(in millions)
Carrying
amount Level 1 Level 2 Level 3 Total
Carrying
amount
Estimated
fair value
Financial assets
Cash and due from banks (1) $ 21,860 21,860 - - 21,860 19,440 19,440
Federal funds sold, securities purchased
under resale agreements and
other short-term investments (1) 137,313 5,046 132,267 - 137,313 44,367 44,367
Mortgages held for sale (2) 4,844 - 3,808 1,045 4,853 3,566 3,566
Loans held for sale (2) 104 - 83 29 112 162 176
Loans, net (3) 763,968 - 56,237 716,114 772,351 731,308 723,867
Nonmarketable equity investments (cost method) 6,799 - 2 8,229 8,231 8,061 8,490
Financial liabilities
Deposits 1,002,835 - 946,922 57,020 1,003,942 920,070 921,803
Short-term borrowings (1) 57,175 - 57,175 - 57,175 49,091 49,091
Long-term debt (4) 127,366 - 119,220 11,063 130,283 125,238 126,484
(1) Amounts consist of financial instruments in which carrying value approximates fair value.
(2) Balance reflects MHFS and LHFS, as applicable, other than those MHFS and LHFS for which election of the fair value option was made.
(3) Loans exclude balances for which the fair value option was elected and also exclude lease financing with a carrying amount of $12.4 billion and $13.1 billion at
December 31, 2012 and 2011, respectively.
(4) The carrying amount and fair value exclude balances for which the fair value option was elected and obligations under capital leases of $12 million and $116 million at
December 31, 2012 and 2011, respectively.
Loan commitments, standby letters of credit and commercial
and similar letters of credit are not included in the table above.
A reasonable estimate of the fair value of these instruments is
the carrying value of deferred fees plus the related allowance.
This amounted to $586 million and $495 million at
December 31, 2012 and 2011, respectively.
219