Wells Fargo 2012 Annual Report Download - page 38
Download and view the complete annual report
Please find page 38 of the 2012 Wells Fargo annual report below. You can navigate through the pages in the report by either clicking on the pages listed below, or by using the keyword search tool below to find specific information within the annual report.-
 1
1 -
2
-
3
-
4
-
5
-
6
-
7
-
8
-
9
-
10
-
11
-
12
-
13
-
14
-
15
-
16
-
17
-
18
-
19
-
20
-
21
-
22
-
23
-
24
-
25
-
26
-
27
-
 28
28 -
 29
29 -
 30
30 -
 31
31 -
 32
32 -
 33
33 -
 34
34 -
 35
35 -
 36
36 -
 37
37 -
 38
38 -
 39
39 -
 40
40 -
 41
41 -
 42
42 -
 43
43 -
 44
44 -
 45
45 -
 46
46 -
 47
47 -
 48
48 -
49
-
50
-
51
-
52
-
53
-
54
-
55
-
56
-
57
-
58
-
59
-
60
-
61
-
62
-
63
-
64
-
65
-
66
-
67
-
68
-
69
-
70
-
71
-
72
-
73
-
74
-
75
-
76
-
77
-
78
-
79
-
80
-
81
-
82
-
83
-
84
-
85
-
86
-
87
-
88
-
89
-
90
-
91
-
92
-
93
-
94
-
95
-
96
-
97
-
98
-
99
-
100
-
101
-
102
-
103
-
104
-
105
-
106
-
107
-
108
-
109
-
110
-
111
-
112
-
113
-
114
-
115
-
116
-
117
-
118
-
119
-
120
-
121
-
122
-
123
-
124
-
125
-
126
-
127
-
128
-
129
-
130
-
131
-
132
-
133
-
134
-
135
-
136
-
137
-
138
-
139
-
140
-
141
-
142
-
143
-
144
-
145
-
146
-
147
-
148
-
149
-
150
-
151
-
152
-
153
-
154
-
155
-
156
-
157
-
158
-
159
-
160
-
161
-
162
-
163
-
164
-
165
-
166
-
167
-
168
-
169
-
170
-
171
-
172
-
173
-
174
-
175
-
176
-
177
-
178
-
179
-
180
-
181
-
182
-
183
-
184
-
185
-
186
-
187
-
188
-
189
-
190
-
191
-
192
-
193
-
194
-
195
-
196
-
197
-
198
-
199
-
200
-
201
-
202
-
203
-
204
-
205
-
206
-
207
-
208
-
209
-
210
-
211
-
212
-
213
-
214
-
215
-
216
-
217
-
218
-
219
-
220
-
221
-
222
-
223
-
224
-
225
-
226
-
227
-
228
-
229
-
230
-
231
-
232
-
233
-
234
-
235
-
236
-
237
-
238
-
239
-
240
-
241
-
242
-
243
-
244
-
245
-
246
-
247
-
248
-
249
-
250
-
251
-
252
 |
 |
Earnings Performance (continued)
Net Interest Income
Net interest income is the interest earned on debt securities,
loans (including yield-related loan fees) and other interest-
earning assets minus the interest paid for deposits, short-term
borrowings and long-term debt. The net interest margin is the
average yield on earning assets minus the average interest rate
paid for deposits and our other sources of funding. Net interest
income and the net interest margin are presented on a taxable-
equivalent basis in Table 5 to consistently reflect income from
taxable and tax-exempt loans and securities based on a 35%
federal statutory tax rate.
While the Company believes that it has the ability to increase
net interest income over time, net interest income and the net
interest margin in any one period can be significantly affected by
a variety of factors including the mix and overall size of our
earning asset portfolio and the cost of funding those assets. In
addition, some variable sources of interest income, such as
resolutions from purchased credit-impaired (PCI) loans, loan
prepayment fees and collection of interest on nonaccrual loans,
can vary from period to period.
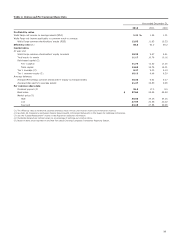
Net interest income on a taxable-equivalent basis was
$43.9 billion in 2012, compared with $43.5 billion in 2011, and
$45.4 billion in 2010. The net interest margin was 3.76% in
2012, down 18 basis points from 3.94% in 2011 and down
50 basis points from 4.26% in 2010. The increase in net interest
income for 2012 compared with 2011, was largely driven by
growth in loans and available-for-sale securities, disciplined
deposit pricing, debt maturities and redemptions of higher
yielding trust preferred securities, which partially offset the
impact of higher yielding loan and investment securities runoff.
The decline in net interest margin in 2012 compared with a year
ago, was largely driven by strong deposit growth, which elevated
short-term investment balances, and the continued runoff of
higher yielding assets.
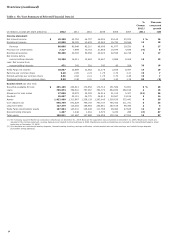
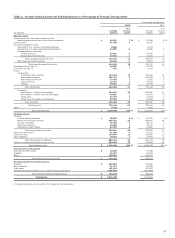
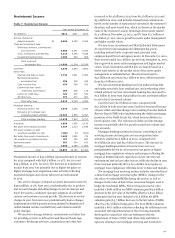
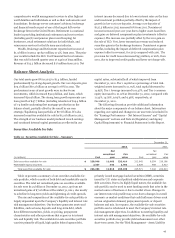
Table 4 presents the components of earning assets and
funding sources as a percentage of earning assets to provide a
more meaningful analysis of year-over-year changes that
influenced net interest income.
Average earning assets increased $67.4 billion in 2012 from a
year ago, as average securities available for sale increased
$39.4 billion and average mortgages held for sale increased
$11.7 billion for the same period, respectively. In addition, the
increase in commercial and industrial loans contributed
$16.3 billion to higher average loans in 2012 compared with a
year ago. These increases in average securities available for sale,
mortgages held for sale and average loans were partially offset by
a $3.1 billion decline in average short-term investments.
Core deposits are an important low-cost source of funding
and affect both net interest income and the net interest margin.
Core deposits include noninterest-bearing deposits, interest-
bearing checking, savings certificates, market rate and other
savings, and certain foreign deposits (Eurodollar sweep
balances). Average core deposits rose to $893.9 billion in 2012
compared with $826.7 billion in 2011 and funded 115% of
average loans compared with 109% a year ago. Average core
deposits increased to 76% of average earning assets in 2012,
compared with 75% a year ago. The cost of these deposits has
continued to decline due to a sustained low interest rate
environment and a shift in our deposit mix from higher cost
certificates of deposit to lower yielding checking and savings
products. About 94% of our average core deposits are in
checking and savings deposits, one of the highest industry
percentages.
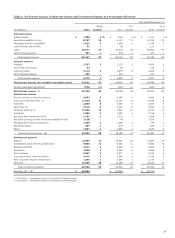
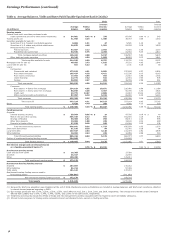
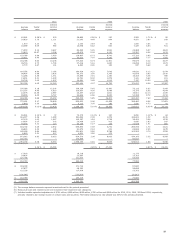
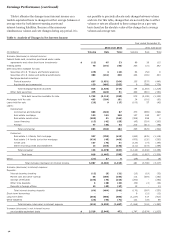
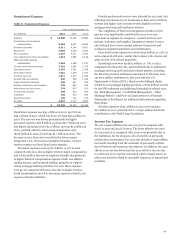
Table 5 presents the individual components of net interest
income and the net interest margin. The effect on interest
income and costs of earning asset and funding mix changes
described above, combined with rate changes during 2012, are
analyzed in Table 6.
36