Wells Fargo 2012 Annual Report Download - page 233
Download and view the complete annual report
Please find page 233 of the 2012 Wells Fargo annual report below. You can navigate through the pages in the report by either clicking on the pages listed below, or by using the keyword search tool below to find specific information within the annual report.-
 1
1 -
2
-
3
-
4
-
5
-
6
-
7
-
8
-
9
-
10
-
11
-
12
-
13
-
14
-
15
-
16
-
17
-
18
-
19
-
20
-
21
-
22
-
23
-
24
-
25
-
26
-
27
-
28
-
29
-
30
-
31
-
32
-
33
-
34
-
35
-
36
-
37
-
38
-
39
-
40
-
41
-
42
-
43
-
44
-
45
-
46
-
47
-
48
-
49
-
50
-
51
-
52
-
53
-
54
-
55
-
56
-
57
-
58
-
59
-
60
-
61
-
62
-
63
-
64
-
65
-
66
-
67
-
68
-
69
-
70
-
71
-
72
-
73
-
74
-
75
-
76
-
77
-
78
-
79
-
80
-
81
-
82
-
83
-
84
-
85
-
86
-
87
-
88
-
89
-
90
-
91
-
92
-
93
-
94
-
95
-
96
-
97
-
98
-
99
-
100
-
101
-
102
-
103
-
104
-
105
-
106
-
107
-
108
-
109
-
110
-
111
-
112
-
113
-
114
-
115
-
116
-
117
-
118
-
119
-
120
-
121
-
122
-
123
-
124
-
125
-
126
-
127
-
128
-
129
-
130
-
131
-
132
-
133
-
134
-
135
-
136
-
137
-
138
-
139
-
140
-
141
-
142
-
143
-
144
-
145
-
146
-
147
-
148
-
149
-
150
-
151
-
152
-
153
-
154
-
155
-
156
-
157
-
158
-
159
-
160
-
161
-
162
-
163
-
164
-
165
-
166
-
167
-
168
-
169
-
170
-
171
-
172
-
173
-
174
-
175
-
176
-
177
-
178
-
179
-
180
-
181
-
182
-
183
-
184
-
185
-
186
-
187
-
188
-
189
-
190
-
191
-
192
-
193
-
194
-
195
-
196
-
197
-
198
-
199
-
200
-
201
-
202
-
203
-
204
-
205
-
206
-
207
-
208
-
209
-
210
-
211
-
212
-
213
-
214
-
215
-
216
-
217
-
218
-
219
-
220
-
221
-
222
-
 223
223 -
 224
224 -
 225
225 -
 226
226 -
 227
227 -
 228
228 -
 229
229 -
 230
230 -
 231
231 -
 232
232 -
 233
233 -
 234
234 -
 235
235 -
 236
236 -
 237
237 -
 238
238 -
 239
239 -
 240
240 -
 241
241 -
 242
242 -
 243
243 -
244
-
245
-
246
-
247
-
248
-
249
-
250
-
251
-
252
 |
 |

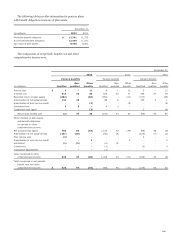
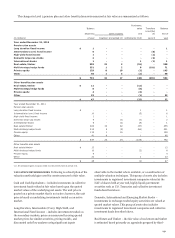
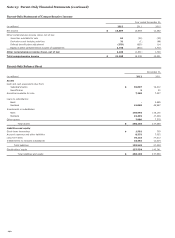
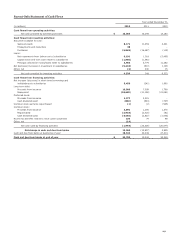
The changes in Level 3 pension plan and other benefit plan assets measured at fair value are summarized as follows:
Purchases,
Balance sales Transfers Balance
beginning Gains (losses) and
Into/(Out
of) end of
(in millions) of year Realized Unrealized (1) settlements (net) Level 3 year
Year ended December 31, 2012
Pension plan assets
Long duration fixed income $ 1 - - - - 1
Intermediate (core) fixed income 6 - - - (6) -
High-yield fixed income 1 - - - (1) -
Domestic large-cap stocks 2 - - - (2) -
International stocks 1 - - 1 (1) 1
Real estate/timber 355 22 2 (51) - 328
Multi-strategy hedge funds 251 1 2 8 (191) 71
Private equity 129 8 10 (2) - 145
Other 46 1 3 (2) - 48
$ 792 32 17 (46) (201) 594
Other benefits plan assets
Real estate/timber $ 12 - - (12) - -
Multi-strategy hedge funds 8 - - (8) - -
Private equity 4 - - (4) - -
Other 23 - - (1) - 22
$ 47 - - (25) - 22
Year ended December 31, 2011
Pension plan assets
Long duration fixed income $ - - - 1 - 1
Intermediate (core) fixed income 10 - 1 (5) - 6
High-yield fixed income 1 - - - - 1
Domestic large-cap stocks 4 - (1) (1) - 2
International stocks 6 - (1) (4) - 1
Real estate/timber 360 10 22 (37) - 355
Multi-strategy hedge funds 313 5 (3) (64) - 251
Private equity 112 1 16 - - 129
Other 41 4 - 1 - 46
$ 847 20 34 (109) - 792
Other benefits plan assets
Real estate/timber $ 12 - - - - 12
Multi-strategy hedge funds 10 - - (2) - 8
Private equity 4 - - - - 4
Other 22 - - 1 - 23
$ 48 - - (1) - 47
(1) All unrealized gains (losses) relate to instruments held at period end.
VALUATION METHODOLOGIES Following is a description of the
valuation methodologies used for assets measured at fair value.
Cash and Cash Equivalents – includes investments in collective
investment funds valued at fair value based upon the quoted
market values of the underlying net assets. The unit price is
quoted on a private market that is not active; however, the unit
price is based on underlying investments traded on an active
market.
Long Duration, Intermediate (Core), High-Yield, and
International Fixed Income – includes investments traded on
the secondary markets; prices are measured by using quoted
market prices for similar securities, pricing models, and
discounted cash flow analyses using significant inputs
observable in the market where available, or a combination of
multiple valuation techniques. This group of assets also includes
investments in registered investment companies valued at the
NAV of shares held at year end, highly liquid government
securities such as U.S. Treasuries and collective investment
funds described above.
Domestic, International and Emerging Market Stocks –
investments in exchange-traded equity securities are valued at
quoted market values. This group of assets also includes
investments in registered investment companies and collective
investment funds described above.
Real Estate and Timber – the fair value of real estate and timber
is estimated based primarily on appraisals prepared by third-
231