Wells Fargo 2012 Annual Report Download - page 222
Download and view the complete annual report
Please find page 222 of the 2012 Wells Fargo annual report below. You can navigate through the pages in the report by either clicking on the pages listed below, or by using the keyword search tool below to find specific information within the annual report.-
 1
1 -
2
-
3
-
4
-
5
-
6
-
7
-
8
-
9
-
10
-
11
-
12
-
13
-
14
-
15
-
16
-
17
-
18
-
19
-
20
-
21
-
22
-
23
-
24
-
25
-
26
-
27
-
28
-
29
-
30
-
31
-
32
-
33
-
34
-
35
-
36
-
37
-
38
-
39
-
40
-
41
-
42
-
43
-
44
-
45
-
46
-
47
-
48
-
49
-
50
-
51
-
52
-
53
-
54
-
55
-
56
-
57
-
58
-
59
-
60
-
61
-
62
-
63
-
64
-
65
-
66
-
67
-
68
-
69
-
70
-
71
-
72
-
73
-
74
-
75
-
76
-
77
-
78
-
79
-
80
-
81
-
82
-
83
-
84
-
85
-
86
-
87
-
88
-
89
-
90
-
91
-
92
-
93
-
94
-
95
-
96
-
97
-
98
-
99
-
100
-
101
-
102
-
103
-
104
-
105
-
106
-
107
-
108
-
109
-
110
-
111
-
112
-
113
-
114
-
115
-
116
-
117
-
118
-
119
-
120
-
121
-
122
-
123
-
124
-
125
-
126
-
127
-
128
-
129
-
130
-
131
-
132
-
133
-
134
-
135
-
136
-
137
-
138
-
139
-
140
-
141
-
142
-
143
-
144
-
145
-
146
-
147
-
148
-
149
-
150
-
151
-
152
-
153
-
154
-
155
-
156
-
157
-
158
-
159
-
160
-
161
-
162
-
163
-
164
-
165
-
166
-
167
-
168
-
169
-
170
-
171
-
172
-
173
-
174
-
175
-
176
-
177
-
178
-
179
-
180
-
181
-
182
-
183
-
184
-
185
-
186
-
187
-
188
-
189
-
190
-
191
-
192
-
193
-
194
-
195
-
196
-
197
-
198
-
199
-
200
-
201
-
202
-
203
-
204
-
205
-
206
-
207
-
208
-
209
-
210
-
211
-
 212
212 -
 213
213 -
 214
214 -
 215
215 -
 216
216 -
 217
217 -
 218
218 -
 219
219 -
 220
220 -
 221
221 -
 222
222 -
 223
223 -
 224
224 -
 225
225 -
 226
226 -
 227
227 -
 228
228 -
 229
229 -
 230
230 -
 231
231 -
 232
232 -
233
-
234
-
235
-
236
-
237
-
238
-
239
-
240
-
241
-
242
-
243
-
244
-
245
-
246
-
247
-
248
-
249
-
250
-
251
-
252
 |
 |

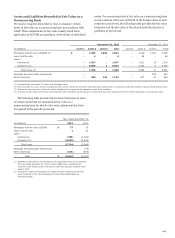
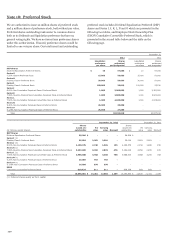
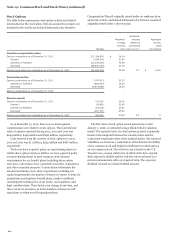
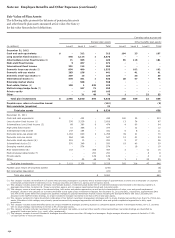
Note 18: Preferred Stock
We are authorized to issue 20 million shares of preferred stock
and 4 million shares of preference stock, both without par value.
Preferred shares outstanding rank senior to common shares
both as to dividends and liquidation preference but have no
general voting rights. We have not issued any preference shares
under this authorization. If issued, preference shares would be
limited to one vote per share. Our total issued and outstanding
preferred stock includes Dividend Equalization Preferred (DEP)
shares and Series I, J, K, L, N and O which are presented in the
following two tables, and Employee Stock Ownership Plan
(ESOP) Cumulative Convertible Preferred Stock, which is
presented in the second table below and the table on the
following page.
December 31,
2012 2011
Liquidation Shares Liquidation Shares
preference authorized preference authorized
per share and designated per share and designated
DEP Shares
Dividend Equalization Preferred Shares $ 10 97,000 $ 10 97,000
Series G
7.25% Class A Preferred Stock 15,000 50,000 15,000 50,000
Series H
Floating Class A Preferred Stock 20,000 50,000 20,000 50,000
Series I
Floating Class A Preferred Stock 100,000 25,010 100,000 25,010
Series J
8.00% Non-Cumulative Perpetual Class A Preferred Stock 1,000 2,300,000 1,000 2,300,000
Series K
7.98% Fixed-to-Floating Non-Cumulative Perpetual Class A Preferred Stock 1,000 3,500,000 1,000 3,500,000
Series L
7.50% Non-Cumulative Perpetual Convertible Class A Preferred Stock 1,000 4,025,000 1,000 4,025,000
Series N
5.20% Non-Cumulative Perpetual Class A Preferred Stock 25,000 30,000 - -
Series O
5.125% Non-Cumulative Perpetual Class A Preferred Stock 25,000 27,600 - -
Total 10,104,610 10,047,010
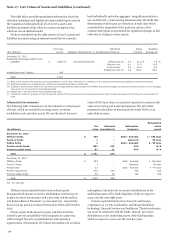
December 31, 2012 December 31, 2011
Shares Shares
issued and Par Carrying issued and Par Carrying
(in millions, except shares) outstanding value value Discount outstanding value value Discount
DEP Shares
Dividend Equalization Preferred Shares 96,546 $ - - - 96,546 $ - - -
Series I (1)
Floating Class A Preferred Stock 25,010 2,501 2,501 - 25,010 2,501 2,501 -
Series J (1)
8.00% Non-Cumulative Perpetual Class A Preferred Stock 2,150,375 2,150 1,995 155 2,150,375 2,150 1,995 155
Series K (1)
7.98% Fixed-to-Floating Non-Cumulative Perpetual Class A Preferred Stock 3,352,000 3,352 2,876 476 3,352,000 3,352 2,876 476
Series L (1)
7.50% Non-Cumulative Perpetual Convertible Class A Preferred Stock 3,968,000 3,968 3,200 768 3,968,000 3,968 3,200 768
Series N (1)
5.20% Non-Cumulative Perpetual Class A Preferred Stock 30,000 750 750 - - - - -
Series O (1)
5.125% Non-Cumulative Per
p
etual Class A Preferred Stock 26,000 650 650 - - - - -
ESOP
Cumulative Convertible Preferred Stock 910,934 911 911 - 858,759 859 859 -
Total 10,558,865 $ 14,282 12,883 1,399 10,450,690 $ 12,830 11,431 1,399
(1) Preferred shares qualify as Tier 1 capital.
220