Wells Fargo 2012 Annual Report Download - page 62
Download and view the complete annual report
Please find page 62 of the 2012 Wells Fargo annual report below. You can navigate through the pages in the report by either clicking on the pages listed below, or by using the keyword search tool below to find specific information within the annual report.-
 1
1 -
2
-
3
-
4
-
5
-
6
-
7
-
8
-
9
-
10
-
11
-
12
-
13
-
14
-
15
-
16
-
17
-
18
-
19
-
20
-
21
-
22
-
23
-
24
-
25
-
26
-
27
-
28
-
29
-
30
-
31
-
32
-
33
-
34
-
35
-
36
-
37
-
38
-
39
-
40
-
41
-
42
-
43
-
44
-
45
-
46
-
47
-
48
-
49
-
50
-
51
-
 52
52 -
 53
53 -
 54
54 -
 55
55 -
 56
56 -
 57
57 -
 58
58 -
 59
59 -
 60
60 -
 61
61 -
 62
62 -
 63
63 -
 64
64 -
 65
65 -
 66
66 -
 67
67 -
 68
68 -
 69
69 -
 70
70 -
 71
71 -
 72
72 -
73
-
74
-
75
-
76
-
77
-
78
-
79
-
80
-
81
-
82
-
83
-
84
-
85
-
86
-
87
-
88
-
89
-
90
-
91
-
92
-
93
-
94
-
95
-
96
-
97
-
98
-
99
-
100
-
101
-
102
-
103
-
104
-
105
-
106
-
107
-
108
-
109
-
110
-
111
-
112
-
113
-
114
-
115
-
116
-
117
-
118
-
119
-
120
-
121
-
122
-
123
-
124
-
125
-
126
-
127
-
128
-
129
-
130
-
131
-
132
-
133
-
134
-
135
-
136
-
137
-
138
-
139
-
140
-
141
-
142
-
143
-
144
-
145
-
146
-
147
-
148
-
149
-
150
-
151
-
152
-
153
-
154
-
155
-
156
-
157
-
158
-
159
-
160
-
161
-
162
-
163
-
164
-
165
-
166
-
167
-
168
-
169
-
170
-
171
-
172
-
173
-
174
-
175
-
176
-
177
-
178
-
179
-
180
-
181
-
182
-
183
-
184
-
185
-
186
-
187
-
188
-
189
-
190
-
191
-
192
-
193
-
194
-
195
-
196
-
197
-
198
-
199
-
200
-
201
-
202
-
203
-
204
-
205
-
206
-
207
-
208
-
209
-
210
-
211
-
212
-
213
-
214
-
215
-
216
-
217
-
218
-
219
-
220
-
221
-
222
-
223
-
224
-
225
-
226
-
227
-
228
-
229
-
230
-
231
-
232
-
233
-
234
-
235
-
236
-
237
-
238
-
239
-
240
-
241
-
242
-
243
-
244
-
245
-
246
-
247
-
248
-
249
-
250
-
251
-
252
 |
 |

Risk Management – Credit Risk Management (continued)
Pick-a-Pay Portfolio The Pick-a-Pay portfolio was one of the
consumer residential first mortgage portfolios we acquired from
Wachovia and a majority of the portfolio was identified as PCI
loans.
The Pick-a-Pay portfolio includes loans that offer payment
options (Pick-a-Pay option payment loans), and also includes
loans that were originated without the option payment feature,
loans that no longer offer the option feature as a result of our
modification efforts since the acquisition, and loans where the
customer voluntarily converted to a fixed-rate product. The Pick-
a-Pay portfolio is included in the consumer real estate 1-4 family
first mortgage class of loans throughout this Report. Real estate
1-4 family junior lien mortgages and lines of credit associated
with Pick-a-Pay loans are reported in the home equity portfolio.
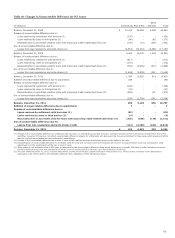
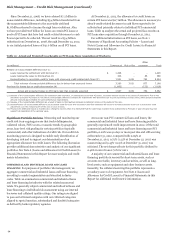
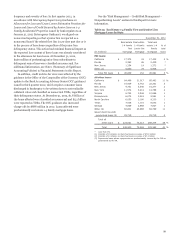
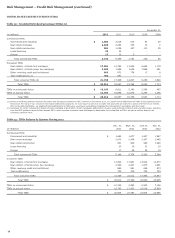
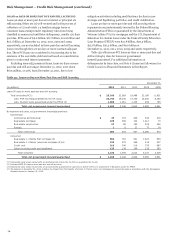
Table 24 provides balances by types of loans as of
December 31, 2012, as a result of modification efforts, compared
to the types of loans included in the portfolio at acquisition.
Total PCI Pick-a-Pay loans were $32.0 billion at
December 31, 2012, compared with $61.0 billion at acquisition.
Modification efforts have predominantly involved option
payment PCI loans, which have declined to 20% of the Pick-a-
Pay portfolio at December 31, 2012, compared with 51% at
acquisition.
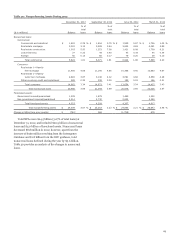
Table 24: Pick-a-Pay Portfolio - Comparison to Acquisition Date
December 31,
2012 (1) 2008
Adjusted Adjusted
unpaid unpaid
principal principal
(in millions) balance (2) % of total balance (2) % of total
Option payment loans $ 31,510 49 % $ 99,937 86 %
Non-option payment adjustable-rate
and fixed-rate loans (3) 8,781 14 15,763 14
Full-term loan modifications 23,528 37 - -
Total adjusted unpaid principal balance (3) $ 63,819 100 % $ 115,700 100 %
Total carrying value $ 58,274 $ 95,315
(1) Reflects $477 million in write-downs resulting from OCC guidance issued in 2012, which requires consumer loans discharged in bankruptcy to be written down to net
realizable collateral value, regardless of their delinquency status.
(2) Adjusted unpaid principal balance includes write-downs taken on loans where severe delinquency (normally 180 days) or other indications of severe borrower financial
stress exist that indicate there will be a loss of contractually due amounts upon final resolution of the loan.
(3) Includes loans refinanced under the Consumer Relief Refinance Program
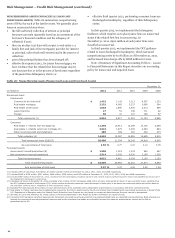
Pick-a-Pay loans may have fixed or adjustable rates with
payment options that include a minimum payment, an interest-
only payment or fully amortizing payment (both 15 and 30 year
options). Total interest deferred due to negative amortization on
Pick-a-Pay loans was $1.4 billion at December 31, 2012, and
$2.0 billion at December 31, 2011. Approximately 90% of the
Pick-a-Pay customers making a minimum payment in
December 2012 did not defer interest, compared with 83% in
December 2011.
Deferral of interest on a Pick-a-Pay loan may continue as
long as the loan balance remains below a pre-defined principal
cap, which is based on the percentage that the current loan
balance represents to the original loan balance. Substantially all
the Pick-a-Pay portfolio has a cap of 125% of the original loan
balance. Most of the Pick-a-Pay loans on which there is a
deferred interest balance re-amortize (the monthly payment
amount is reset or “recast”) on the earlier of the date when the
loan balance reaches its principal cap, or generally the 10-year
anniversary of the loan. After a recast, the customers’ new
payment terms are reset to the amount necessary to repay the
balance over the rest of the original loan term.
Due to the terms of the Pick-a-Pay portfolio, there is little
recast risk in the near term. Based on assumptions of a flat rate
environment, if all eligible customers elect the minimum
payment option 100% of the time and no balances prepay, we
would expect the following balances of loans to recast based on
reaching the principal cap: $21 million in 2013, $58 million in
2014 and $109 million in 2015. In addition, in a flat rate
environment, we would expect the following balances of loans to
start fully amortizing due to reaching their recast anniversary
date: $101 million in 2013, $332 million in 2014 and
$951 million in 2015. In 2012, the amount of loans reaching their
recast anniversary date and also having a payment change over
the annual 7.5% reset was $12 million.
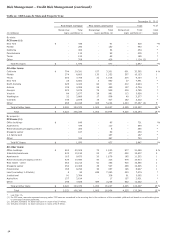
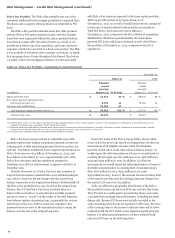
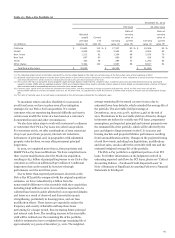
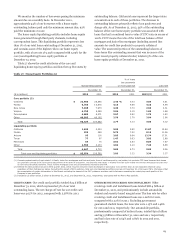
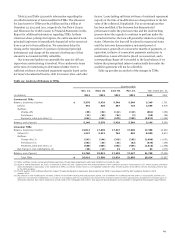
Table 25 reflects the geographic distribution of the Pick-a-
Pay portfolio broken out between PCI loans and all other loans.
The LTV ratio is a useful metric in predicting future real estate
1-4 family first mortgage loan performance, including potential
charge-offs. Because PCI loans were initially recorded at fair
value, including write-downs for expected credit losses, the ratio
of the carrying value to the current collateral value will be lower
compared with the LTV based on the adjusted unpaid principal
balance. For informational purposes, we have included both
ratios for PCI loans in the following table.
60