Wells Fargo 2012 Annual Report Download - page 89
Download and view the complete annual report
Please find page 89 of the 2012 Wells Fargo annual report below. You can navigate through the pages in the report by either clicking on the pages listed below, or by using the keyword search tool below to find specific information within the annual report.-
 1
1 -
2
-
3
-
4
-
5
-
6
-
7
-
8
-
9
-
10
-
11
-
12
-
13
-
14
-
15
-
16
-
17
-
18
-
19
-
20
-
21
-
22
-
23
-
24
-
25
-
26
-
27
-
28
-
29
-
30
-
31
-
32
-
33
-
34
-
35
-
36
-
37
-
38
-
39
-
40
-
41
-
42
-
43
-
44
-
45
-
46
-
47
-
48
-
49
-
50
-
51
-
52
-
53
-
54
-
55
-
56
-
57
-
58
-
59
-
60
-
61
-
62
-
63
-
64
-
65
-
66
-
67
-
68
-
69
-
70
-
71
-
72
-
73
-
74
-
75
-
76
-
77
-
78
-
 79
79 -
 80
80 -
 81
81 -
 82
82 -
 83
83 -
 84
84 -
 85
85 -
 86
86 -
 87
87 -
 88
88 -
 89
89 -
 90
90 -
 91
91 -
 92
92 -
 93
93 -
 94
94 -
 95
95 -
 96
96 -
 97
97 -
 98
98 -
 99
99 -
100
-
101
-
102
-
103
-
104
-
105
-
106
-
107
-
108
-
109
-
110
-
111
-
112
-
113
-
114
-
115
-
116
-
117
-
118
-
119
-
120
-
121
-
122
-
123
-
124
-
125
-
126
-
127
-
128
-
129
-
130
-
131
-
132
-
133
-
134
-
135
-
136
-
137
-
138
-
139
-
140
-
141
-
142
-
143
-
144
-
145
-
146
-
147
-
148
-
149
-
150
-
151
-
152
-
153
-
154
-
155
-
156
-
157
-
158
-
159
-
160
-
161
-
162
-
163
-
164
-
165
-
166
-
167
-
168
-
169
-
170
-
171
-
172
-
173
-
174
-
175
-
176
-
177
-
178
-
179
-
180
-
181
-
182
-
183
-
184
-
185
-
186
-
187
-
188
-
189
-
190
-
191
-
192
-
193
-
194
-
195
-
196
-
197
-
198
-
199
-
200
-
201
-
202
-
203
-
204
-
205
-
206
-
207
-
208
-
209
-
210
-
211
-
212
-
213
-
214
-
215
-
216
-
217
-
218
-
219
-
220
-
221
-
222
-
223
-
224
-
225
-
226
-
227
-
228
-
229
-
230
-
231
-
232
-
233
-
234
-
235
-
236
-
237
-
238
-
239
-
240
-
241
-
242
-
243
-
244
-
245
-
246
-
247
-
248
-
249
-
250
-
251
-
252
 |
 |

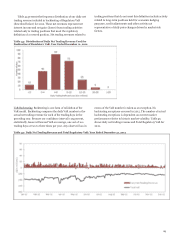
average expected remaining maturity of the debt securities
within this portfolio was 5.5 years at December 31, 2012. Of the
$220.9 billion (cost basis) of debt securities in this portfolio at
December 31, 2012, $48.0 billion (22%) is expected to mature or
be prepaid in 2013 and an additional $44.4 billion (20%) in
2014. Asset liquidity is further enhanced by our ability to sell or
securitize loans in secondary markets and to pledge loans to
access secured borrowing facilities through the Federal Home
Loan Banks (FHLB) and the FRB. In 2012, we sold mortgage
loans of $483.5 billion. The amount of mortgage loans and other
consumer loans available to be sold, securitized or pledged was
approximately $211.1 billion at December 31, 2012.
Core customer deposits have historically provided a sizeable
source of relatively stable and low-cost funds. At
December 31, 2012, core deposits were 118% of total loans
compared with 113% a year ago. Additional funding is provided
by long-term debt, other foreign deposits, and short-term
borrowings. Long-term debt averaged $127.5 billion in 2012 and
$141.1 billion in 2011. Short-term borrowings averaged
$51.2 billion in 2012 and $51.8 billion in 2011.
We anticipate making capital expenditures of approximately
$1.4 billion in 2013 for our stores, relocation and remodeling of
our facilities, and routine replacement of furniture, equipment
and servers. We fund expenditures from various sources,
including liquid assets and borrowings.
We access domestic and international capital markets for
long-term funding (generally greater than one year) through
issuances of registered debt securities, private placements and
asset-backed secured funding. Investors in the long-term capital
markets, as well as other market participants, generally will
consider, among other factors, a company’s debt rating in
making investment decisions. Rating agencies base their ratings
on many quantitative and qualitative factors, including capital
adequacy, liquidity, asset quality, business mix, the level and
quality of earnings, and rating agency assumptions regarding the
probability and extent of Federal financial assistance or support
for certain large financial institutions. Adverse changes in these
factors could result in a reduction of our credit rating; however,
a reduction in credit rating would not cause us to violate any of
our debt covenants.
Generally, rating agencies review a firm’s ratings at least
annually. During 2012, our ratings were affirmed by Moody’s,
Standard & Poor’s and Fitch Ratings, and confirmed by DBRS.
There were no changes to our credit ratings in 2012. See the
“Risk Management – Asset/Liability Management” and “Risk
Factors” sections of this Report for additional information
regarding our credit ratings as of December 31, 2012, and the
potential impact a credit rating downgrade would have on our
liquidity and operations, as well as Note 16 (Derivatives) to
Financial Statements in this Report for information regarding
additional collateral and funding obligations required for certain
derivative instruments in the event our credit ratings were to fall
below investment grade.
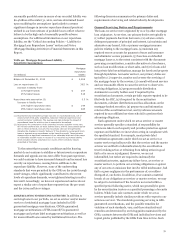
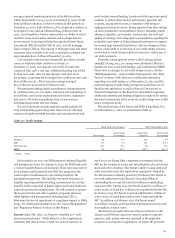
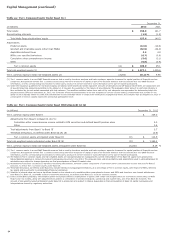
The credit ratings of the Parent and Wells Fargo Bank, N.A.
as of December 31, 2012, are presented in Table 47.
Table 47: Credit Ratings
Wells Fargo & Company Wells Fargo Bank, N.A.
Senior debt
Short-term
borrowings
Long-term
deposits
Short-term
borrowings
Moody's A2 P-1 Aa3 P-1
S&P A+ A-1 AA- A-1+
Fitch Ratings AA- F1+ AA F1+
DBRS AA R-1* AA** R-1**
* middle **high
On December 20, 2011, the FRB proposed enhanced liquidity
risk management rules. On January 6, 2013, the BCBS endorsed
a revised liquidity framework for banks. These rules have not yet
been adopted and finalized by the FRB. The proposed rules
would require modifications to our existing liquidity risk
management processes. This includes increased frequency of
liquidity reporting and stress testing, maintenance of a 30-day
liquidity buffer comprised of highly-liquid assets and additional
corporate governance requirements. We will continue to analyze
the proposed rules and other regulatory proposals that may
affect liquidity risk management, including Basel III, to
determine the level of operational or compliance impact to Wells
Fargo. For additional information see the “Capital Management”
and “Regulatory Reform” sections in this Report.
Parent Under SEC rules, our Parent is classified as a “well-
known seasoned issuer,” which allows it to file a registration
statement that does not have a limit on issuance capacity. In
April 2012, the Parent filed a registration statement with the
SEC for the issuance of senior and subordinated notes, preferred
stock and other securities. The Parent’s ability to issue debt and
other securities under this registration statement is limited by
the debt issuance authority granted by the Board. The Parent is
currently authorized by the Board to issue $60 billion in
outstanding short-term debt and $170 billion in outstanding
long-term debt. During 2012, the Parent issued $17.0 billion of
senior notes, of which $12.1 billion were registered with the SEC.
In January 2013, the Parent issued an additional $1.1 billion of
senior notes, of which $100 million were registered with the
SEC. In addition, in February 2013, the Parent issued
$2.0 billion of registered subordinated medium-term notes and
$100 million of senior notes.
The Parent’s proceeds from securities issued in 2012 and
January and February 2013 were used for general corporate
purposes, and, unless otherwise specified in the applicable
prospectus or prospectus supplement, we expect the proceeds
87