Wells Fargo 2012 Annual Report Download - page 53
Download and view the complete annual report
Please find page 53 of the 2012 Wells Fargo annual report below. You can navigate through the pages in the report by either clicking on the pages listed below, or by using the keyword search tool below to find specific information within the annual report.-
 1
1 -
2
-
3
-
4
-
5
-
6
-
7
-
8
-
9
-
10
-
11
-
12
-
13
-
14
-
15
-
16
-
17
-
18
-
19
-
20
-
21
-
22
-
23
-
24
-
25
-
26
-
27
-
28
-
29
-
30
-
31
-
32
-
33
-
34
-
35
-
36
-
37
-
38
-
39
-
40
-
41
-
42
-
 43
43 -
 44
44 -
 45
45 -
 46
46 -
 47
47 -
 48
48 -
 49
49 -
 50
50 -
 51
51 -
 52
52 -
 53
53 -
 54
54 -
 55
55 -
 56
56 -
 57
57 -
 58
58 -
 59
59 -
 60
60 -
 61
61 -
 62
62 -
 63
63 -
64
-
65
-
66
-
67
-
68
-
69
-
70
-
71
-
72
-
73
-
74
-
75
-
76
-
77
-
78
-
79
-
80
-
81
-
82
-
83
-
84
-
85
-
86
-
87
-
88
-
89
-
90
-
91
-
92
-
93
-
94
-
95
-
96
-
97
-
98
-
99
-
100
-
101
-
102
-
103
-
104
-
105
-
106
-
107
-
108
-
109
-
110
-
111
-
112
-
113
-
114
-
115
-
116
-
117
-
118
-
119
-
120
-
121
-
122
-
123
-
124
-
125
-
126
-
127
-
128
-
129
-
130
-
131
-
132
-
133
-
134
-
135
-
136
-
137
-
138
-
139
-
140
-
141
-
142
-
143
-
144
-
145
-
146
-
147
-
148
-
149
-
150
-
151
-
152
-
153
-
154
-
155
-
156
-
157
-
158
-
159
-
160
-
161
-
162
-
163
-
164
-
165
-
166
-
167
-
168
-
169
-
170
-
171
-
172
-
173
-
174
-
175
-
176
-
177
-
178
-
179
-
180
-
181
-
182
-
183
-
184
-
185
-
186
-
187
-
188
-
189
-
190
-
191
-
192
-
193
-
194
-
195
-
196
-
197
-
198
-
199
-
200
-
201
-
202
-
203
-
204
-
205
-
206
-
207
-
208
-
209
-
210
-
211
-
212
-
213
-
214
-
215
-
216
-
217
-
218
-
219
-
220
-
221
-
222
-
223
-
224
-
225
-
226
-
227
-
228
-
229
-
230
-
231
-
232
-
233
-
234
-
235
-
236
-
237
-
238
-
239
-
240
-
241
-
242
-
243
-
244
-
245
-
246
-
247
-
248
-
249
-
250
-
251
-
252
 |
 |

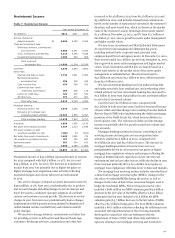
We manage our credit risk by establishing what we believe
are sound credit policies for underwriting new business, while
monitoring and reviewing the performance of our existing loan
portfolios. We employ various credit risk management and
monitoring activities to mitigate risks associated with multiple
risk factors affecting loans we hold, could acquire or originate
including:
x Loan concentrations and related credit quality
x Counterparty credit risk
x Economic and market conditions
x Legislative or regulatory mandates
x Changes in interest rates
x Merger and acquisition activities
x Reputation risk
Our credit risk management oversight process is governed
centrally, but provides for decentralized management and
accountability by our lines of business. Our overall credit
process includes comprehensive credit policies, disciplined
credit underwriting, frequent and detailed risk measurement
and modeling, extensive credit training programs, and a
continual loan review and audit process.
A key to our credit risk management is adherence to a well
controlled underwriting process, which we believe is
appropriate for the needs of our customers as well as investors
who purchase the loans or securities collateralized by the loans.
Non-Strategic and Liquidating Loan Portfolios
We
continually evaluate and modify our credit policies to address
appropriate levels of risk. We may designate certain portfolios
and loan products as non-strategic or liquidating to cease their
continued origination as we actively work to limit losses and
reduce our exposures.
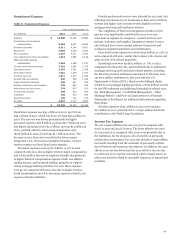
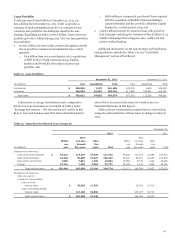
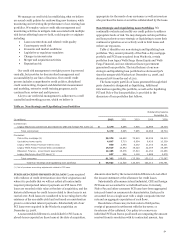
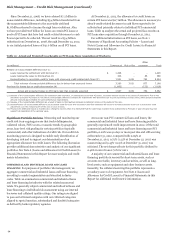
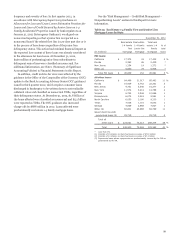
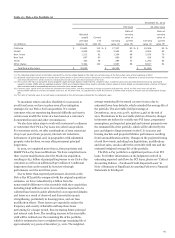
Table 17 identifies our non-strategic and liquidating loan
portfolios. They consist primarily of the Pick-a-Pay mortgage
portfolio and PCI loans acquired from Wachovia, certain
portfolios from legacy Wells Fargo Home Equity and Wells
Fargo Financial, and our education finance government
guaranteed loan portfolio. The total balance of our non-
strategic and liquidating loan portfolios has decreased 50%
since the merger with Wachovia at December 31, 2008, and
decreased 16% from the end of 2011.
The home equity portfolio of loans generated through third
party channels is designated as liquidating. Additional
information regarding this portfolio, as well as the liquidating
PCI and Pick-a-Pay loan portfolios, is provided in the
discussion of loan portfolios that follows.
Table 17: Non-Strategic and Liquidating Loan Portfolios
Outstanding balance
December 31,
(in millions) 2012 2011 2010 2009 2008
Commercial:
Legacy Wachovia commercial and industrial, CRE and foreign PCI loans (1) $ 3,170 5,695 7,935 12,988 18,704
Total commercial 3,170 5,695 7,935 12,988 18,704
Consumer:
Pick-a-Pay mortgage (1) 58,274 65,652 74,815 85,238 95,315
Liquidating home equity 4,647 5,710 6,904 8,429 10,309
Legacy Wells Fargo Financial indirect auto 830 2,455 6,002 11,253 18,221
Legacy Wells Fargo Financial debt consolidation 14,519 16,542 19,020 22,364 25,299
Education Finance - government guaranteed 12,465 15,376 17,510 21,150 20,465
Legacy Wachovia other PCI loans (1) 657 896 1,118 1,688 2,478
Total consumer 91,392 106,631 125,369 150,122 172,087
Total non-strategic and liquidating loan portfolios $ 94,562 112,326 133,304 163,110 190,791
(1) Net of purchase accounting adjustments related to PCI loans.
PURCHASED CREDIT-IMPAIRED (PCI) LOANS Loans acquired
with evidence of credit deterioration since their origination and
where it is probable that we will not collect all contractually
required principal and interest payments are PCI loans. PCI
loans are recorded at fair value at the date of acquisition, and the
historical allowance for credit losses related to these loans is not
carried over. Such loans are considered to be accruing due to the
existence of the accretable yield and not based on consideration
given to contractual interest payments. Substantially all of our
PCI loans were acquired in the Wachovia acquisition on
December 31, 2008.
A nonaccretable difference is established for PCI loans to
absorb losses expected on those loans at the date of acquisition.
Amounts absorbed by the nonaccretable difference do not affect
the income statement or the allowance for credit losses.
Substantially all commercial and industrial, CRE and foreign
PCI loans are accounted for as individual loans. Conversely,
Pick-a-Pay and other consumer PCI loans have been aggregated
into pools based on common risk characteristics. Each pool is
accounted for as a single asset with a single composite interest
rate and an aggregate expectation of cash flows.
Resolutions of loans may include sales to third parties,
receipt of payments in settlement with the borrower, or
foreclosure of the collateral. Our policy is to remove an
individual PCI loan from a pool based on comparing the amount
received from its resolution with its contractual amount. Any
51