Wells Fargo 2012 Annual Report Download - page 9
Download and view the complete annual report
Please find page 9 of the 2012 Wells Fargo annual report below. You can navigate through the pages in the report by either clicking on the pages listed below, or by using the keyword search tool below to find specific information within the annual report.-
 1
1 -
 2
2 -
 3
3 -
 4
4 -
 5
5 -
 6
6 -
 7
7 -
 8
8 -
 9
9 -
 10
10 -
 11
11 -
 12
12 -
 13
13 -
 14
14 -
 15
15 -
 16
16 -
 17
17 -
 18
18 -
 19
19 -
 20
20 -
21
-
22
-
23
-
24
-
25
-
26
-
27
-
28
-
29
-
30
-
31
-
32
-
33
-
34
-
35
-
36
-
37
-
38
-
39
-
40
-
41
-
42
-
43
-
44
-
45
-
46
-
47
-
48
-
49
-
50
-
51
-
52
-
53
-
54
-
55
-
56
-
57
-
58
-
59
-
60
-
61
-
62
-
63
-
64
-
65
-
66
-
67
-
68
-
69
-
70
-
71
-
72
-
73
-
74
-
75
-
76
-
77
-
78
-
79
-
80
-
81
-
82
-
83
-
84
-
85
-
86
-
87
-
88
-
89
-
90
-
91
-
92
-
93
-
94
-
95
-
96
-
97
-
98
-
99
-
100
-
101
-
102
-
103
-
104
-
105
-
106
-
107
-
108
-
109
-
110
-
111
-
112
-
113
-
114
-
115
-
116
-
117
-
118
-
119
-
120
-
121
-
122
-
123
-
124
-
125
-
126
-
127
-
128
-
129
-
130
-
131
-
132
-
133
-
134
-
135
-
136
-
137
-
138
-
139
-
140
-
141
-
142
-
143
-
144
-
145
-
146
-
147
-
148
-
149
-
150
-
151
-
152
-
153
-
154
-
155
-
156
-
157
-
158
-
159
-
160
-
161
-
162
-
163
-
164
-
165
-
166
-
167
-
168
-
169
-
170
-
171
-
172
-
173
-
174
-
175
-
176
-
177
-
178
-
179
-
180
-
181
-
182
-
183
-
184
-
185
-
186
-
187
-
188
-
189
-
190
-
191
-
192
-
193
-
194
-
195
-
196
-
197
-
198
-
199
-
200
-
201
-
202
-
203
-
204
-
205
-
206
-
207
-
208
-
209
-
210
-
211
-
212
-
213
-
214
-
215
-
216
-
217
-
218
-
219
-
220
-
221
-
222
-
223
-
224
-
225
-
226
-
227
-
228
-
229
-
230
-
231
-
232
-
233
-
234
-
235
-
236
-
237
-
238
-
239
-
240
-
241
-
242
-
243
-
244
-
245
-
246
-
247
-
248
-
249
-
250
-
251
-
252
 |
 |
Our Wealth, Brokerage and Retirement (WBR)
segment reported revenue of $12.2billion and record net
income of $1.3billion in2012, driven by strong growth
in brokerage-managed account fees. WBR client assets
grew to $1.4trillion in2012, a 7percent increase from
2011, including 20percent growth in brokerage-managed
account assets and 6percent growth in average deposits.
WBR continued its success in cross-selling products to
clients. The average products grew during 2012 to more
than 10products per household.
What’s the outlook for revenue growth in2013? Though
we don’t set public revenue goals, we do set our sights
on continuing to grow by earning more of our customers’
business, growing market share across business lines, and
making acquisitions that make sense for our customers
and our business model.
Reducing expenses
At WellsFargo, we don’t believe growing and saving
are mutually exclusive objectives. This is why reducing
expenses is a top priority even as we emphasize growing
revenue. We want to grow eciently in ways that result in
products and services that our customers value.
This discipline is expressed by our “eciencyratio,”
which reflects how much we spend in expenses for every
dollar of revenue we earn. In2012, WellsFargo’s eciency
ratio was 58.5percent, the lowest of our industry’s four
largest companies. This meant we spent 58.5cents
for every dollar of revenue we generated. However,
we didn’t cut expenses solely to achieve this feat. We
struck a balance between managing expenses wisely and
spending on opportunities. So we hired people where we
saw opportunities for growth and reduced operations
where we no longer saw value for our customers.
Since 2008, we have reduced the size of our overall
real estate occupancy portfolio by more than 16million
square feet, net of growth. That’s almost six Empire
State Buildings. More than 4.5million square feet of this
reduction took place as we grew revenue in2012. So, we’ve
reduced our company’s physical footprint while improving
the productivity and eciency of the space weuse.
Sometimes the opportunity to save spans operations.
Education Financial Services, which oers private loans
for college students, and Shareowner Services, which
services companies and their shareholders, recognized
they each had seasonal volume peaks; other times, when
business slowed, they had too much sta. Now the two
organizations train each other’s teams, reducing the need
for each to hire seasonal temporary help. This has also
created development opportunities for team members.
Most important, Education Financial Services didn’t miss
out on opportunities to lend, and Shareowner Services
continued to receive high satisfaction scores from its
customers— including our shareholders.
Living our vision and values
Putting customers first, growing revenue, reducing
expenses— these are goals shared by many companies.
How they’re achieved is what ultimately reflects
a company’s culture. We evaluate our leaders on
their cultural performance as well as their financial
performance, knowing that our culture binds us together
as a team. At WellsFargo, we believe in the power of
plurals. It’s not about I, me, and mine. It’s about us, we,
and ours. Our formula for success is team success, not
individual success, and it works. The average tenure at
WellsFargo among my direct reports is 28years.
Our culture is outlined in The Vision & Values of
WellsFargo, a 41-page booklet that details our business
./-/ "4ƇɄ*0-Ʉ1'0 .ƇɄ)Ʉ*0-Ʉ- .*)Ʉ!*-Ʉ $)"ƆɄ./Ʉ4 -ƇɄ
we sent a refreshed version of this 19-year-old document
to each of our more than 265,000 team members and
made it available to the public on wellsfargo.com. Many
team members highlight favorite passages. Others refer
to our vision and values when they’re solving business
problems. It’s a document that’s widely used because it
sums up who we are today and how we plan to become
one of the world’s great companies.
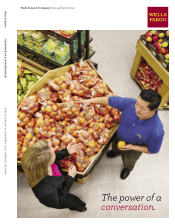
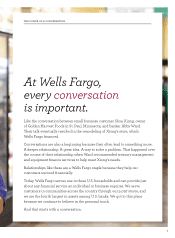
A new advertising campaign we launched last year
brings an aspect of our vision and values to life— our
culture of listening to customers. Called “Conversations,”
the campaign showcases how trusted conversations with
our customers can aect their lives. One conversation
can lead to so much more. The stories highlighted in this
Annual Report reflect that. By listening to our customers
and deepening relationships with them, we support their
success. At WellsFargo, we live our vision and values.
That’s how we build trust, and that’s how we dierentiate
ourselves.
Connecting with communities and stakeholders
Our team members set WellsFargo apart through their
support of the communities we serve. Team members
make personal donations. They volunteer. They quickly
respond when disaster strikes.