Wells Fargo 2012 Annual Report Download - page 144
Download and view the complete annual report
Please find page 144 of the 2012 Wells Fargo annual report below. You can navigate through the pages in the report by either clicking on the pages listed below, or by using the keyword search tool below to find specific information within the annual report.-
 1
1 -
2
-
3
-
4
-
5
-
6
-
7
-
8
-
9
-
10
-
11
-
12
-
13
-
14
-
15
-
16
-
17
-
18
-
19
-
20
-
21
-
22
-
23
-
24
-
25
-
26
-
27
-
28
-
29
-
30
-
31
-
32
-
33
-
34
-
35
-
36
-
37
-
38
-
39
-
40
-
41
-
42
-
43
-
44
-
45
-
46
-
47
-
48
-
49
-
50
-
51
-
52
-
53
-
54
-
55
-
56
-
57
-
58
-
59
-
60
-
61
-
62
-
63
-
64
-
65
-
66
-
67
-
68
-
69
-
70
-
71
-
72
-
73
-
74
-
75
-
76
-
77
-
78
-
79
-
80
-
81
-
82
-
83
-
84
-
85
-
86
-
87
-
88
-
89
-
90
-
91
-
92
-
93
-
94
-
95
-
96
-
97
-
98
-
99
-
100
-
101
-
102
-
103
-
104
-
105
-
106
-
107
-
108
-
109
-
110
-
111
-
112
-
113
-
114
-
115
-
116
-
117
-
118
-
119
-
120
-
121
-
122
-
123
-
124
-
125
-
126
-
127
-
128
-
129
-
130
-
131
-
132
-
133
-
 134
134 -
 135
135 -
 136
136 -
 137
137 -
 138
138 -
 139
139 -
 140
140 -
 141
141 -
 142
142 -
 143
143 -
 144
144 -
 145
145 -
 146
146 -
 147
147 -
 148
148 -
 149
149 -
 150
150 -
 151
151 -
 152
152 -
 153
153 -
 154
154 -
155
-
156
-
157
-
158
-
159
-
160
-
161
-
162
-
163
-
164
-
165
-
166
-
167
-
168
-
169
-
170
-
171
-
172
-
173
-
174
-
175
-
176
-
177
-
178
-
179
-
180
-
181
-
182
-
183
-
184
-
185
-
186
-
187
-
188
-
189
-
190
-
191
-
192
-
193
-
194
-
195
-
196
-
197
-
198
-
199
-
200
-
201
-
202
-
203
-
204
-
205
-
206
-
207
-
208
-
209
-
210
-
211
-
212
-
213
-
214
-
215
-
216
-
217
-
218
-
219
-
220
-
221
-
222
-
223
-
224
-
225
-
226
-
227
-
228
-
229
-
230
-
231
-
232
-
233
-
234
-
235
-
236
-
237
-
238
-
239
-
240
-
241
-
242
-
243
-
244
-
245
-
246
-
247
-
248
-
249
-
250
-
251
-
252
 |
 |

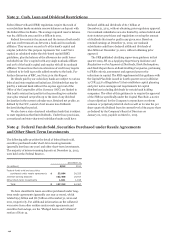
Note 3: Cash, Loan and Dividend Restrictions
Federal Reserve Board (FRB) regulations require that each of
our subsidiary banks maintain reserve balances on deposit with
the Federal Reserve Banks. The average required reserve balance
was $9.1 billion in 2012 and $7.0 billion in 2011.
Federal law restricts the amount and the terms of both credit
and non-credit transactions between a bank and its nonbank
affiliates. They may not exceed 10% of the bank's capital and
surplus (which for this purpose represents Tier 1 and Tier 2
capital, as calculated under the risk-based capital (RBC)
guidelines, plus the balance of the allowance for credit losses
excluded from Tier 2 capital) with any single nonbank affiliate
and 20% of the bank's capital and surplus with all its nonbank
affiliates. Transactions that are extensions of credit may require
collateral to be held to provide added security to the bank. For
further discussion of RBC, see Note 26 in this Report.
Dividends paid by our subsidiary banks are subject to various
federal and state regulatory limitations. Dividends that may be
paid by a national bank without the express approval of the
Office of the Comptroller of the Currency (OCC) are limited to
that bank's retained net profits for the preceding two calendar
years plus retained net profits up to the date of any dividend
declaration in the current calendar year. Retained net profits, as
defined by the OCC, consist of net income less dividends
declared during the period.
We also have a state-chartered subsidiary bank that is subject
to state regulations that limit dividends. Under those provisions,
our national and state-chartered subsidiary banks could have
declared additional dividends of $1.7 billion at
December 31, 2012, without obtaining prior regulatory approval.
Our nonbank subsidiaries are also limited by certain federal and
state statutory provisions and regulations covering the amount
of dividends that may be paid in any given year. Based on
retained earnings at December 31, 2012, our nonbank
subsidiaries could have declared additional dividends of
$6.2 billion at December 31, 2012, without obtaining prior
approval.
The FRB published clarifying supervisory guidance in first
quarter 2009, SR 09-4 Applying Supervisory Guidance and
Regulations on the Payment of Dividends, Stock Redemptions,
and Stock Repurchases at Bank Holding Companies, pertaining
to FRB's criteria, assessment and approval process for
reductions in capital. The FRB supplemented this guidance with
the Capital Plan Rule issued in fourth quarter 2011 (codified at
12 CFR 225.8 of Regulation Y) that establishes capital planning
and prior notice and approval requirements for capital
distributions including dividends by certain bank holding
companies. The effect of this guidance is to require the approval
of the FRB (or specifically under the Capital Plan Rule, a notice
of non-objection) for the Company to repurchase or redeem
common or perpetual preferred stock as well as to raise the per
share quarterly dividend from its current level of $0.25 per share
as declared by the Company’s Board of Directors on
January 22, 2013, payable on March 1, 2013.
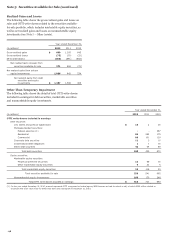
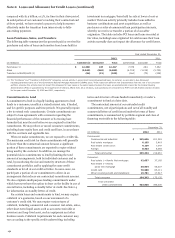
Note 4: Federal Funds Sold, Securities Purchased under Resale Agreements
and Other Short-Term Investments
The following table provides the detail of federal funds sold,
securities purchased under short-term resale agreements
(generally less than one year) and other short-term investments.
The majority of interest-earning deposits at December 31, 2012,
were held at the Federal Reserve.
December 31,
(in millions) 2012 2011
Federal funds sold and securities
purchased under resale agreements $ 33,884 24,255
Interest-earning deposits 102,408 18,917
Other short-term investments 1,021 1,195
Total $ 137,313 44,367
We have classified in loans securities purchased under long-
term resale agreements (generally one year or more), which
totaled $9.5 billion and $8.7 billion at December 31, 2012 and
2011, respectively. For additional information on the collateral
we receive from other entities under resale agreements and
securities borrowings, see the “Pledged Assets and Collateral”
section of Note 14.
142