Wells Fargo 2012 Annual Report Download - page 223
Download and view the complete annual report
Please find page 223 of the 2012 Wells Fargo annual report below. You can navigate through the pages in the report by either clicking on the pages listed below, or by using the keyword search tool below to find specific information within the annual report.-
 1
1 -
2
-
3
-
4
-
5
-
6
-
7
-
8
-
9
-
10
-
11
-
12
-
13
-
14
-
15
-
16
-
17
-
18
-
19
-
20
-
21
-
22
-
23
-
24
-
25
-
26
-
27
-
28
-
29
-
30
-
31
-
32
-
33
-
34
-
35
-
36
-
37
-
38
-
39
-
40
-
41
-
42
-
43
-
44
-
45
-
46
-
47
-
48
-
49
-
50
-
51
-
52
-
53
-
54
-
55
-
56
-
57
-
58
-
59
-
60
-
61
-
62
-
63
-
64
-
65
-
66
-
67
-
68
-
69
-
70
-
71
-
72
-
73
-
74
-
75
-
76
-
77
-
78
-
79
-
80
-
81
-
82
-
83
-
84
-
85
-
86
-
87
-
88
-
89
-
90
-
91
-
92
-
93
-
94
-
95
-
96
-
97
-
98
-
99
-
100
-
101
-
102
-
103
-
104
-
105
-
106
-
107
-
108
-
109
-
110
-
111
-
112
-
113
-
114
-
115
-
116
-
117
-
118
-
119
-
120
-
121
-
122
-
123
-
124
-
125
-
126
-
127
-
128
-
129
-
130
-
131
-
132
-
133
-
134
-
135
-
136
-
137
-
138
-
139
-
140
-
141
-
142
-
143
-
144
-
145
-
146
-
147
-
148
-
149
-
150
-
151
-
152
-
153
-
154
-
155
-
156
-
157
-
158
-
159
-
160
-
161
-
162
-
163
-
164
-
165
-
166
-
167
-
168
-
169
-
170
-
171
-
172
-
173
-
174
-
175
-
176
-
177
-
178
-
179
-
180
-
181
-
182
-
183
-
184
-
185
-
186
-
187
-
188
-
189
-
190
-
191
-
192
-
193
-
194
-
195
-
196
-
197
-
198
-
199
-
200
-
201
-
202
-
203
-
204
-
205
-
206
-
207
-
208
-
209
-
210
-
211
-
212
-
 213
213 -
 214
214 -
 215
215 -
 216
216 -
 217
217 -
 218
218 -
 219
219 -
 220
220 -
 221
221 -
 222
222 -
 223
223 -
 224
224 -
 225
225 -
 226
226 -
 227
227 -
 228
228 -
 229
229 -
 230
230 -
 231
231 -
 232
232 -
 233
233 -
234
-
235
-
236
-
237
-
238
-
239
-
240
-
241
-
242
-
243
-
244
-
245
-
246
-
247
-
248
-
249
-
250
-
251
-
252
 |
 |

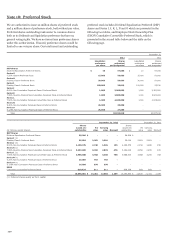
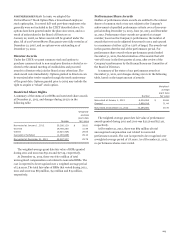
In August 2012, we issued 30 million Depositary Shares, each
representing a 1/1,000th interest in a share of the Non-
Cumulative Perpetual Class A Preferred Stock, Series N, for an
aggregate public offering price of $750 million.
In November 2012, we issued 26 million Depositary Shares,
each representing a 1/1,000th interest in a share of the Non-
Cumulative Perpetual Class A Preferred Stock, Series O, for an
aggregate public offering price of $650 million.
See Note 8 for additional information on our trust preferred
securities. We do not have a commitment to issue Series G or H
preferred stock.
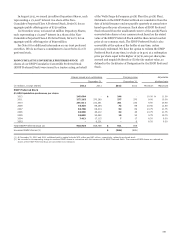
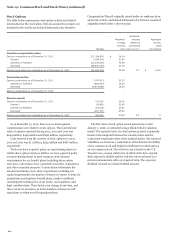
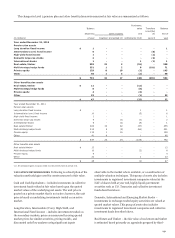
ESOP CUMULATIVE CONVERTIBLE PREFERRED STOCK All
shares of our ESOP Cumulative Convertible Preferred Stock
(ESOP Preferred Stock) were issued to a trustee acting on behalf
of the Wells Fargo & Company 401(k) Plan (the 401(k) Plan).
Dividends on the ESOP Preferred Stock are cumulative from the
date of initial issuance and are payable quarterly at annual rates
based upon the year of issuance. Each share of ESOP Preferred
Stock released from the unallocated reserve of the 401(k) Plan is
converted into shares of our common stock based on the stated
value of the ESOP Preferred Stock and the then current market
price of our common stock. The ESOP Preferred Stock is also
convertible at the option of the holder at any time, unless
previously redeemed. We have the option to redeem the ESOP
Preferred Stock at any time, in whole or in part, at a redemption
price per share equal to the higher of (a) $1,000 per share plus
accrued and unpaid dividends or (b) the fair market value, as
defined in the Certificates of Designation for the ESOP Preferred
Stock.
Shares issued and outstanding Carrying value Adjustable
December 31, December 31, dividend rate
(in millions, except shares) 2012 2011 2012 2011 Minimum Maximum
ESOP Preferred Stock
$1,000 liquidation preference per share
2012 245,604 - $ 246 - 10.00 % 11.00
2011 277,263 370,280 277 370 9.00 10.00
2010 201,011 231,361 201 232 9.50 10.50
2008 73,434 89,154 73 89 10.50 11.50
2007 53,768 68,414 54 69 10.75 11.75
2006 33,559 46,112 34 46 10.75 11.75
2005 18,882 30,092 19 30 9.75 10.75
2004 7,413 17,115 7 17 8.50 9.50
2003 - 6,231 - 6 8.50 9.50
Total ESOP Preferred Stock (1) 910,934 858,759 $ 911 859
Unearned ESOP shares (2) $ (986) (926)
(1) At December 31, 2012 and 2011, additional paid-in capital included $75 million and $67 million, respectively, related to preferred stock.
(2) We recorded a corresponding charge to unearned ESOP shares in connection with the issuance of the ESOP Preferred Stock. The unearned ESOP shares are reduced as
shares of the ESOP Preferred Stock are committed to be released.
221