Wells Fargo 2012 Annual Report Download - page 212
Download and view the complete annual report
Please find page 212 of the 2012 Wells Fargo annual report below. You can navigate through the pages in the report by either clicking on the pages listed below, or by using the keyword search tool below to find specific information within the annual report.-
 1
1 -
2
-
3
-
4
-
5
-
6
-
7
-
8
-
9
-
10
-
11
-
12
-
13
-
14
-
15
-
16
-
17
-
18
-
19
-
20
-
21
-
22
-
23
-
24
-
25
-
26
-
27
-
28
-
29
-
30
-
31
-
32
-
33
-
34
-
35
-
36
-
37
-
38
-
39
-
40
-
41
-
42
-
43
-
44
-
45
-
46
-
47
-
48
-
49
-
50
-
51
-
52
-
53
-
54
-
55
-
56
-
57
-
58
-
59
-
60
-
61
-
62
-
63
-
64
-
65
-
66
-
67
-
68
-
69
-
70
-
71
-
72
-
73
-
74
-
75
-
76
-
77
-
78
-
79
-
80
-
81
-
82
-
83
-
84
-
85
-
86
-
87
-
88
-
89
-
90
-
91
-
92
-
93
-
94
-
95
-
96
-
97
-
98
-
99
-
100
-
101
-
102
-
103
-
104
-
105
-
106
-
107
-
108
-
109
-
110
-
111
-
112
-
113
-
114
-
115
-
116
-
117
-
118
-
119
-
120
-
121
-
122
-
123
-
124
-
125
-
126
-
127
-
128
-
129
-
130
-
131
-
132
-
133
-
134
-
135
-
136
-
137
-
138
-
139
-
140
-
141
-
142
-
143
-
144
-
145
-
146
-
147
-
148
-
149
-
150
-
151
-
152
-
153
-
154
-
155
-
156
-
157
-
158
-
159
-
160
-
161
-
162
-
163
-
164
-
165
-
166
-
167
-
168
-
169
-
170
-
171
-
172
-
173
-
174
-
175
-
176
-
177
-
178
-
179
-
180
-
181
-
182
-
183
-
184
-
185
-
186
-
187
-
188
-
189
-
190
-
191
-
192
-
193
-
194
-
195
-
196
-
197
-
198
-
199
-
200
-
201
-
 202
202 -
 203
203 -
 204
204 -
 205
205 -
 206
206 -
 207
207 -
 208
208 -
 209
209 -
 210
210 -
 211
211 -
 212
212 -
 213
213 -
 214
214 -
 215
215 -
 216
216 -
 217
217 -
 218
218 -
 219
219 -
 220
220 -
 221
221 -
 222
222 -
223
-
224
-
225
-
226
-
227
-
228
-
229
-
230
-
231
-
232
-
233
-
234
-
235
-
236
-
237
-
238
-
239
-
240
-
241
-
242
-
243
-
244
-
245
-
246
-
247
-
248
-
249
-
250
-
251
-
252
 |
 |

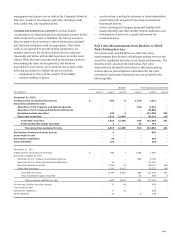
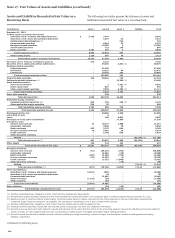
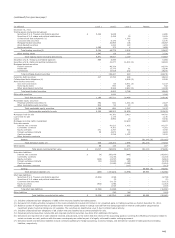
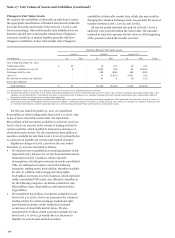
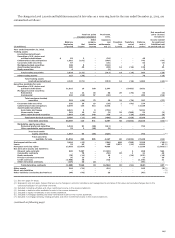
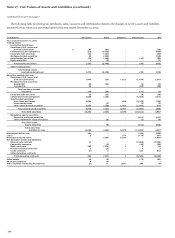
Note 17: Fair Values of Assets and Liabilities (continued)
(continued from previous page)
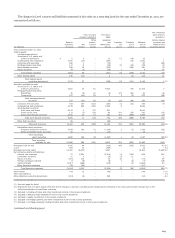
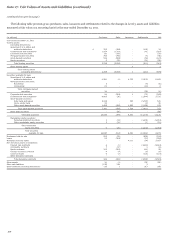
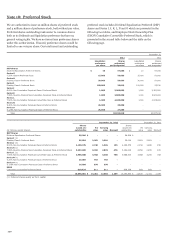
The following table presents gross purchases, sales, issuances and settlements related to the changes in Level 3 assets and liabilities
measured at fair value on a recurring basis for the year ended December 31, 2011.
(in millions) Purchases Sales Issuances Settlements Net
Year ended December 31, 2011
Trading assets
(
excludin
g
derivatives
)
:
Securities of U.S. states and
political subdivisions $ 313 (199) - (102) 12
Collateralized debt obligations 1,054 (1,310) - (41) (297)
Corporate debt securities 80 (150) - - (70)
Mortgage-backed securities 759 (790) - (5) (36)
Asset-backed securities 516 (585) - (53) (122)
Equity securities 6 (22) - (12) (28)
Total trading securities 2,728 (3,056) - (213) (541)
Other trading assets - - 2 - 2
Total trading assets
(excluding derivatives) 2,728 (3,056) 2 (213) (539)
Securities available for sale:
Securities of U.S. states and
political subdivisions 4,280 (4) 4,723 (2,076) 6,923
Mortgage-backed securities:
Residential 3 - - (9) (6)
Commercial 21 - - (19) 2
Total mortgage-backed
securities 24 - - (28) (4)
Corporate debt securities 94 (208) 1 (72) (185)
Collateralized debt obligations 4,805 (36) - (1,044) 3,725
Asset-backed securities:
Auto loans and leases 5,918 - 333
(
5,720
)
531
Home equity loans 44 - - (4) 40
Other asset-backed securities 1,428 (456) 1,395 (2,186) 181
Total asset-backed securities 7,390 (456) 1,728 (7,910) 752
Other debt securities - (85) - - (85)
Total debt securities 16,593 (789) 6,452 (11,130) 11,126
Marketable equity securities:
Perpetual preferred securities 1 (13) - (1,231) (1,243)
Other marketable equity securities 3 (12) - (1) (10)
Total marketable
equity securities 4 (25) - (1,232) (1,253)
Total securities
available for sale 16,597 (814) 6,452 (12,362) 9,873
Mortgages held for sale 576 (21) - (659) (104)
Loans 23 (309) - (13) (299)
Mortgage servicing rights - - 4,011 (54) 3,957
Net derivative assets and liabilities:
Interest rate contracts 6 (1) - (3,419) (3,414)
Commodity contracts 7 (17) - 1 (9)
Equity contracts 123 (255) - 160 28
Foreign exchange contracts 4 (4) - (6) (6)
Credit contracts 6 (3) - (126) (123)
Other derivative contracts - - - - -
Total derivative contracts 146 (280) - (3,390) (3,524)
Other assets 10 (1) - (91) (82)
Short sale liabilities (125) 124 - 1 -
Other liabilities (excluding derivatives) (10) 1 - 317 308
210