Wells Fargo 2012 Annual Report Download - page 64
Download and view the complete annual report
Please find page 64 of the 2012 Wells Fargo annual report below. You can navigate through the pages in the report by either clicking on the pages listed below, or by using the keyword search tool below to find specific information within the annual report.-
 1
1 -
2
-
3
-
4
-
5
-
6
-
7
-
8
-
9
-
10
-
11
-
12
-
13
-
14
-
15
-
16
-
17
-
18
-
19
-
20
-
21
-
22
-
23
-
24
-
25
-
26
-
27
-
28
-
29
-
30
-
31
-
32
-
33
-
34
-
35
-
36
-
37
-
38
-
39
-
40
-
41
-
42
-
43
-
44
-
45
-
46
-
47
-
48
-
49
-
50
-
51
-
52
-
53
-
 54
54 -
 55
55 -
 56
56 -
 57
57 -
 58
58 -
 59
59 -
 60
60 -
 61
61 -
 62
62 -
 63
63 -
 64
64 -
 65
65 -
 66
66 -
 67
67 -
 68
68 -
 69
69 -
 70
70 -
 71
71 -
 72
72 -
 73
73 -
 74
74 -
75
-
76
-
77
-
78
-
79
-
80
-
81
-
82
-
83
-
84
-
85
-
86
-
87
-
88
-
89
-
90
-
91
-
92
-
93
-
94
-
95
-
96
-
97
-
98
-
99
-
100
-
101
-
102
-
103
-
104
-
105
-
106
-
107
-
108
-
109
-
110
-
111
-
112
-
113
-
114
-
115
-
116
-
117
-
118
-
119
-
120
-
121
-
122
-
123
-
124
-
125
-
126
-
127
-
128
-
129
-
130
-
131
-
132
-
133
-
134
-
135
-
136
-
137
-
138
-
139
-
140
-
141
-
142
-
143
-
144
-
145
-
146
-
147
-
148
-
149
-
150
-
151
-
152
-
153
-
154
-
155
-
156
-
157
-
158
-
159
-
160
-
161
-
162
-
163
-
164
-
165
-
166
-
167
-
168
-
169
-
170
-
171
-
172
-
173
-
174
-
175
-
176
-
177
-
178
-
179
-
180
-
181
-
182
-
183
-
184
-
185
-
186
-
187
-
188
-
189
-
190
-
191
-
192
-
193
-
194
-
195
-
196
-
197
-
198
-
199
-
200
-
201
-
202
-
203
-
204
-
205
-
206
-
207
-
208
-
209
-
210
-
211
-
212
-
213
-
214
-
215
-
216
-
217
-
218
-
219
-
220
-
221
-
222
-
223
-
224
-
225
-
226
-
227
-
228
-
229
-
230
-
231
-
232
-
233
-
234
-
235
-
236
-
237
-
238
-
239
-
240
-
241
-
242
-
243
-
244
-
245
-
246
-
247
-
248
-
249
-
250
-
251
-
252
 |
 |
Risk Management – Credit Risk Management (continued)
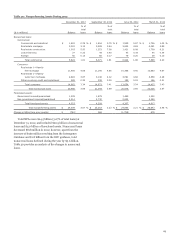
HOME EQUITY PORTFOLIOS Our home equity portfolios consist
of real estate 1-4 family junior lien mortgages and first and
junior lines of credit secured by real estate. Our first lien lines of
credit represent 21% of our home equity portfolio and are
included in real estate 1-4 family first mortgages. The majority of
our junior lien loan products are amortizing payment loans with
fixed interest rates and repayment periods between 5 to 30
years. Junior lien loans with balloon payments at the end of the
repayment term represent a small portion of our junior lien
loans.
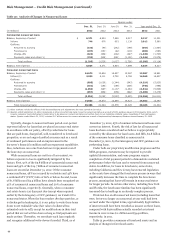
Our first and junior lien lines of credit products generally
have a draw period of 10 years with variable interest rates and
payment options during the draw period of (1) interest only or
(2) 1.5% of total outstanding balance. During the draw period,
the borrower has the option of converting all or a portion of the
line from a variable interest rate to a fixed rate with terms
including interest-only payments for a fixed period between
three to seven years or a fully amortizing payment with a fixed
period between five to 30 years. At the end of the draw period, a
line of credit generally converts to an amortizing payment loan
with repayment terms of up to 30 years based on the balance at
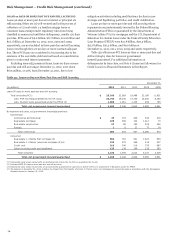
time of conversion. At December 31, 2012, our lines of credit
portfolio had an outstanding balance of $84.6 billion, of which
$2.1 billion (2% of our total outstanding balance) is in its
amortization period, another $8.2 billion (10%) will reach their
end of draw period during 2013 through 2014, $29.4 billion
(35%) during 2015 through 2017, and $44.9 billion (53%) will
convert in subsequent years. This portfolio had unfunded credit
commitments of $77.8 billion at December 31, 2012. The lines
that enter their amortization period may experience higher
delinquencies and higher loss rates than the ones in their draw
period. At December 31, 2012, $223 million, or 11% of
outstanding lines of credit that are amortizing, primarily due to
reaching the end of draw period, were 30 or more days past due,
compared with $1.9 billion, or 2% for lines in their draw period.
In anticipation of our customers reaching their contractual end
of draw we have created a process to help borrowers effectively
make the transition from interest-only to fully-amortizing
payments.
We continuously monitor the credit performance of our
junior lien mortgage portfolio for trends and factors that
influence the frequency and severity of loss. We have observed
that the severity of loss for junior lien mortgages is high and
generally not affected by whether we or a third party own or
service the related first mortgage, but that the frequency of loss
has historically been lower when we own or service the first
mortgage. In general, we have limited information available on
the delinquency status of the third party owned or serviced
senior lien where we also hold a junior lien. To capture this
inherent loss content, we use the experience of our junior lien
mortgages behind delinquent first liens that are owned or
serviced by us adjusted for observed higher delinquency rates
associated with junior lien mortgages behind third party first
mortgages. We incorporate this inherent loss content into our
allowance for loan losses. Our allowance process for junior liens
ensures appropriate consideration of the relative difference in
loss experience for junior liens behind first lien mortgage loans
we own or service, compared with those behind first lien
mortgage loans owned or serviced by third parties. In addition,
our allowance process for junior liens that are current, but are in
their revolving period, appropriately reflects the inherent loss
where the borrower is delinquent on the corresponding first lien
mortgage loans.
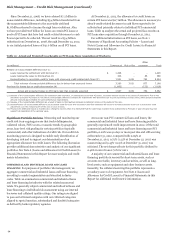
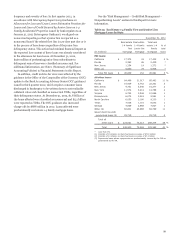
Table 26 summarizes delinquency and loss rates by the
holder of the lien. For additional information regarding current
junior liens behind delinquent first lien loans, see the “Risk
Management – Credit Risk Management – Real Estate 1-4
Family First and Junior Lien Mortgage Loans” section in this
Report.
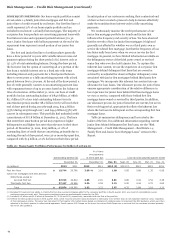
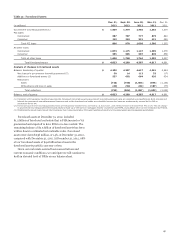
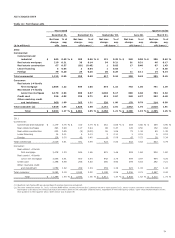
Table 26: Home Equity Portfolios Performance by Holder of 1st Lien (1)
% of loans
two payments
Outstanding balance (2) or more past due Loss rate (annualized) quarter ended
December 31, December 31, Dec. 31, Sept. 30, June 30, Mar. 31, Dec. 31,
(in millions) 2012 2011 2012 2011 2012 (3) 2012 (3) 2012 2012 2011
First lien lines $ 19,744 20,786 3.08 % 3.10 1.00 0.95 0.88 1.35 0.95
Junior lien mortgages and lines behind:
Wells Fargo owned or
serviced first lien 37,913 42,810 2.65 2.91 3.81 4.96 3.34 3.54 3.48
Third party first lien 37,417 42,996 2.86 3.59 3.15 5.40 3.44 3.72 3.83
Total $ 95,074 106,592 2.82 3.22 2.97 4.32 2.89 3.18 3.13
(1)
Excludes PCI loans and real estate 1-4 family first lien line reverse mortgages added to the consumer portfolio in fourth quarter 2011 as a result of consolidating reverse
mortgage loans previously sold. These reverse mortgage loans are predominantly insured by the FHA.
(2) Includes $1.3 billion and $1.5 billion at December 31, 2012 and 2011, respectively, associated with the Pick-a-Pay portfolio.
(3) Reflects the OCC guidance issued in third quarter 2012, which requires consumer loans discharged in bankruptcy to be written down to net realizable collateral value, regardless
of their delinquency status. The junior lien loss rates for third quarter 2012 reflect losses based on estimates of collateral value to implement the OCC guidance, which were then
adjusted in the fourth quarter to reflect actual appraisals. Fourth quarter 2012 losses on the junior liens where Wells Fargo own or services first lien remained elevated primarily
due to the OCC guidance.
62