Wells Fargo 2012 Annual Report Download - page 196
Download and view the complete annual report
Please find page 196 of the 2012 Wells Fargo annual report below. You can navigate through the pages in the report by either clicking on the pages listed below, or by using the keyword search tool below to find specific information within the annual report.-
 1
1 -
2
-
3
-
4
-
5
-
6
-
7
-
8
-
9
-
10
-
11
-
12
-
13
-
14
-
15
-
16
-
17
-
18
-
19
-
20
-
21
-
22
-
23
-
24
-
25
-
26
-
27
-
28
-
29
-
30
-
31
-
32
-
33
-
34
-
35
-
36
-
37
-
38
-
39
-
40
-
41
-
42
-
43
-
44
-
45
-
46
-
47
-
48
-
49
-
50
-
51
-
52
-
53
-
54
-
55
-
56
-
57
-
58
-
59
-
60
-
61
-
62
-
63
-
64
-
65
-
66
-
67
-
68
-
69
-
70
-
71
-
72
-
73
-
74
-
75
-
76
-
77
-
78
-
79
-
80
-
81
-
82
-
83
-
84
-
85
-
86
-
87
-
88
-
89
-
90
-
91
-
92
-
93
-
94
-
95
-
96
-
97
-
98
-
99
-
100
-
101
-
102
-
103
-
104
-
105
-
106
-
107
-
108
-
109
-
110
-
111
-
112
-
113
-
114
-
115
-
116
-
117
-
118
-
119
-
120
-
121
-
122
-
123
-
124
-
125
-
126
-
127
-
128
-
129
-
130
-
131
-
132
-
133
-
134
-
135
-
136
-
137
-
138
-
139
-
140
-
141
-
142
-
143
-
144
-
145
-
146
-
147
-
148
-
149
-
150
-
151
-
152
-
153
-
154
-
155
-
156
-
157
-
158
-
159
-
160
-
161
-
162
-
163
-
164
-
165
-
166
-
167
-
168
-
169
-
170
-
171
-
172
-
173
-
174
-
175
-
176
-
177
-
178
-
179
-
180
-
181
-
182
-
183
-
184
-
185
-
 186
186 -
 187
187 -
 188
188 -
 189
189 -
 190
190 -
 191
191 -
 192
192 -
 193
193 -
 194
194 -
 195
195 -
 196
196 -
 197
197 -
 198
198 -
 199
199 -
 200
200 -
 201
201 -
 202
202 -
 203
203 -
 204
204 -
 205
205 -
 206
206 -
207
-
208
-
209
-
210
-
211
-
212
-
213
-
214
-
215
-
216
-
217
-
218
-
219
-
220
-
221
-
222
-
223
-
224
-
225
-
226
-
227
-
228
-
229
-
230
-
231
-
232
-
233
-
234
-
235
-
236
-
237
-
238
-
239
-
240
-
241
-
242
-
243
-
244
-
245
-
246
-
247
-
248
-
249
-
250
-
251
-
252
 |
 |

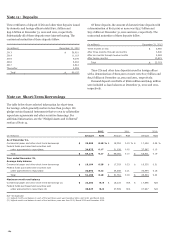
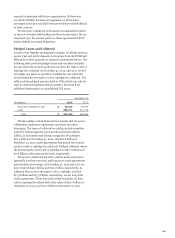
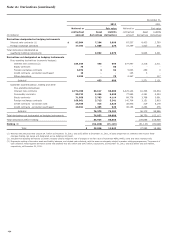
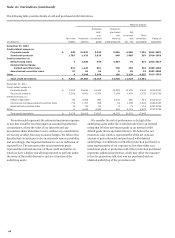
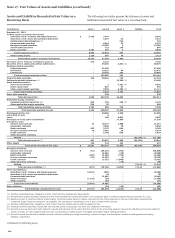
Note 16: Derivatives (continued)
December 31,
2012 2011
Notional or Fair value Notional or Fair value
contractual Asset Liability contractual Asset Liability
(in millions) amount derivatives derivatives amount derivatives derivatives
Derivatives designated as hedging instruments
Interest rate contracts (1) $ 92,004 7,284 2,696 87,537 8,423 2,769
Foreign exchange contracts 27,382 1,808 274 22,269 1,523 572
Total derivatives designated as
qualifying hedging instruments 9,092 2,970 9,946 3,341
Derivatives not designated as hedging instruments
Free-standing derivatives (economic hedges):
Interest rate contracts (2) 334,555 450 694 377,497 2,318 2,011
Equity contracts 75 - 50 - - -
Foreign exchange contracts 3,074 3 64 5,833 250 3
Credit contracts - protection purchased 16 - - 125 3 -
Other derivatives 2,296 - 78 2,367 - 117
Subtotal 453 886 2,571 2,131
Customer accommodation, trading and other
free-standing derivatives:
Interest rate contracts 2,774,783 63,617 65,305 2,425,144 81,336 83,834
Commodity contracts 90,732 3,456 3,590 77,985 4,351 4,234
Equity contracts 71,958 3,783 4,114 68,778 3,768 3,661
Foreign exchange contracts 166,061 3,713 3,241 140,704 3,151 2,803
Credit contracts - protection sold 26,455 315 2,623 38,403 319 5,178
Credit contracts - protection purchased 29,021 1,495 329 36,156 3,254 276
Subtotal 76,379 79,202 96,179 99,986
Total derivatives not designated as hedging instruments 76,832 80,088 98,750 102,117
Total derivatives before netting 85,924 83,058 108,696 105,458
Netting (3) (62,108) (71,116) (81,143) (89,990)
Total $ 23,816 11,942 27,553 15,468
(1) Notional amounts presented exclude $4.7 billion at December 31, 2012, and $15.5 billion at December 31, 2011, of basis swaps that are combined with receive fixed-
rate/pay floating-rate swaps and designated as one hedging instrument.
(2) Includes free-standing derivatives (economic hedges) used to hedge the risk of changes in the fair value of residential MSRs, MHFS, loans and other interests held.
(3) Represents netting of derivative asset and liability balances, and related cash collateral, with the same counterparty subject to master netting arrangements. The amount of
cash collateral netted against derivative assets and liabilities was $5.0 billion and $14.5 billion, respectively, at December 31, 2012, and $6.6 billion and $15.4 billion,
respectively, at December 31, 2011.
194