Wells Fargo 2012 Annual Report Download - page 55
Download and view the complete annual report
Please find page 55 of the 2012 Wells Fargo annual report below. You can navigate through the pages in the report by either clicking on the pages listed below, or by using the keyword search tool below to find specific information within the annual report.-
 1
1 -
2
-
3
-
4
-
5
-
6
-
7
-
8
-
9
-
10
-
11
-
12
-
13
-
14
-
15
-
16
-
17
-
18
-
19
-
20
-
21
-
22
-
23
-
24
-
25
-
26
-
27
-
28
-
29
-
30
-
31
-
32
-
33
-
34
-
35
-
36
-
37
-
38
-
39
-
40
-
41
-
42
-
43
-
44
-
 45
45 -
 46
46 -
 47
47 -
 48
48 -
 49
49 -
 50
50 -
 51
51 -
 52
52 -
 53
53 -
 54
54 -
 55
55 -
 56
56 -
 57
57 -
 58
58 -
 59
59 -
 60
60 -
 61
61 -
 62
62 -
 63
63 -
 64
64 -
 65
65 -
66
-
67
-
68
-
69
-
70
-
71
-
72
-
73
-
74
-
75
-
76
-
77
-
78
-
79
-
80
-
81
-
82
-
83
-
84
-
85
-
86
-
87
-
88
-
89
-
90
-
91
-
92
-
93
-
94
-
95
-
96
-
97
-
98
-
99
-
100
-
101
-
102
-
103
-
104
-
105
-
106
-
107
-
108
-
109
-
110
-
111
-
112
-
113
-
114
-
115
-
116
-
117
-
118
-
119
-
120
-
121
-
122
-
123
-
124
-
125
-
126
-
127
-
128
-
129
-
130
-
131
-
132
-
133
-
134
-
135
-
136
-
137
-
138
-
139
-
140
-
141
-
142
-
143
-
144
-
145
-
146
-
147
-
148
-
149
-
150
-
151
-
152
-
153
-
154
-
155
-
156
-
157
-
158
-
159
-
160
-
161
-
162
-
163
-
164
-
165
-
166
-
167
-
168
-
169
-
170
-
171
-
172
-
173
-
174
-
175
-
176
-
177
-
178
-
179
-
180
-
181
-
182
-
183
-
184
-
185
-
186
-
187
-
188
-
189
-
190
-
191
-
192
-
193
-
194
-
195
-
196
-
197
-
198
-
199
-
200
-
201
-
202
-
203
-
204
-
205
-
206
-
207
-
208
-
209
-
210
-
211
-
212
-
213
-
214
-
215
-
216
-
217
-
218
-
219
-
220
-
221
-
222
-
223
-
224
-
225
-
226
-
227
-
228
-
229
-
230
-
231
-
232
-
233
-
234
-
235
-
236
-
237
-
238
-
239
-
240
-
241
-
242
-
243
-
244
-
245
-
246
-
247
-
248
-
249
-
250
-
251
-
252
 |
 |

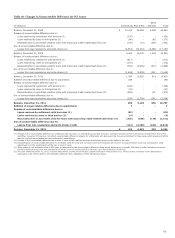
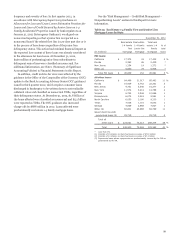
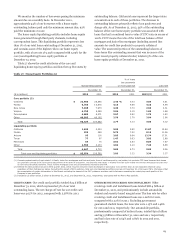
Table 18: Changes in Nonaccretable Difference for PCI Loans
Othe
r
(in millions) Commercial Pick-a-Pay consumer Total
Balance, December 31, 2008 $ 10,410 26,485 4,069 40,964
Release of nonaccretable difference due to:
Loans resolved by settlement with borrower (1) (330) - - (330)
Loans resolved by sales to third parties (2) (86) - (85) (171)
Reclassification to accretable yield for loans with improving credit-related cash flows (3) (138) (27) (276) (441)
Use of nonaccretable difference due to:
Losses from loan resolutions and write-downs (4) (4,853) (10,218) (2,086) (17,157)
Balance, December 31, 2009 5,003 16,240 1,622 22,865
Release of nonaccretable difference due to:
Loans resolved by settlement with borrower (1) (817) - - (817)
Loans resolved by sales to third parties (2) (172) - - (172)
Reclassification to accretable yield for loans with improving credit-related cash flows (3) (726) (2,356) (317) (3,399)
Use of nonaccretable difference due to:
Losses from loan resolutions and write-downs (4) (1,698) (2,959) (391) (5,048)
Balance, December 31, 2010 1,590 10,925 914 13,429
Addition of nonaccretable difference due to acquisitions 188 - - 188
Release of nonaccretable difference due to:
Loans resolved by settlement with borrower (1) (198) - - (198)
Loans resolved by sales to third parties (2) (41) - - (41)
Reclassification to accretable yield for loans with improving credit-related cash flows (3) (352) - (21) (373)
Use of nonaccretable difference due to:
Losses from loan resolutions and write-downs (4) (258) (1,799) (241) (2,298)
Balance, December 31, 2011 929 9,126 652 10,707
Addition of nonaccretable difference due to acquisitions 7 - - 7
Release of nonaccretable difference due to:
Loans resolved by settlement with borrower (1) (81) - - (81)
Loans resolved by sales to third parties (2) (4) - - (4)
Reclassification to accretable yield for loans with improving credit-related cash flows (3) (315) (648) (178) (1,141)
Use of nonaccretable difference due to:
Losses from loan resolutions and write-downs (4)(5) (114) (2,246) (164) (2,524)
Balance, December 31, 2012 $ 422 6,232 310 6,964
(1)
Release of the nonaccretable difference for settlement with borrower, on individually accounted PCI loans, increases interest income in the period of settlement. Pick-a-Pay
and Other consumer PCI loans do not reflect nonaccretable difference releases for settlements with borrowers due to pool accounting for those loans, which assumes that the
amount received approximates the pool performance expectations.
(2) Release of the nonaccretable difference as a result of sales to third parties increases noninterest income in the period of the sale.
(3) Reclassification of nonaccretable difference to accretable yield for loans with increased cash flow estimates will result in increased interest income as a prospective yield
adjustment over the remaining life of the loan or pool of loans.
(4) Write-downs to net realizable value of PCI loans are absorbed by the nonaccretable difference when severe delinquency (normally 180 days) or other indications of severe
borrower financial stress exist that indicate there will be a loss of contractually due amounts upon final resolution of the loan.
(5) The year ended December 31, 2012, includes $462 million resulting from the OCC guidance issued in third quarter 2012, which requires consumer loans discharged in
bankruptcy to be written down to net realizable collateral value, regardless of their delinquency status.
53