Wells Fargo 2012 Annual Report Download - page 230
Download and view the complete annual report
Please find page 230 of the 2012 Wells Fargo annual report below. You can navigate through the pages in the report by either clicking on the pages listed below, or by using the keyword search tool below to find specific information within the annual report.-
 1
1 -
2
-
3
-
4
-
5
-
6
-
7
-
8
-
9
-
10
-
11
-
12
-
13
-
14
-
15
-
16
-
17
-
18
-
19
-
20
-
21
-
22
-
23
-
24
-
25
-
26
-
27
-
28
-
29
-
30
-
31
-
32
-
33
-
34
-
35
-
36
-
37
-
38
-
39
-
40
-
41
-
42
-
43
-
44
-
45
-
46
-
47
-
48
-
49
-
50
-
51
-
52
-
53
-
54
-
55
-
56
-
57
-
58
-
59
-
60
-
61
-
62
-
63
-
64
-
65
-
66
-
67
-
68
-
69
-
70
-
71
-
72
-
73
-
74
-
75
-
76
-
77
-
78
-
79
-
80
-
81
-
82
-
83
-
84
-
85
-
86
-
87
-
88
-
89
-
90
-
91
-
92
-
93
-
94
-
95
-
96
-
97
-
98
-
99
-
100
-
101
-
102
-
103
-
104
-
105
-
106
-
107
-
108
-
109
-
110
-
111
-
112
-
113
-
114
-
115
-
116
-
117
-
118
-
119
-
120
-
121
-
122
-
123
-
124
-
125
-
126
-
127
-
128
-
129
-
130
-
131
-
132
-
133
-
134
-
135
-
136
-
137
-
138
-
139
-
140
-
141
-
142
-
143
-
144
-
145
-
146
-
147
-
148
-
149
-
150
-
151
-
152
-
153
-
154
-
155
-
156
-
157
-
158
-
159
-
160
-
161
-
162
-
163
-
164
-
165
-
166
-
167
-
168
-
169
-
170
-
171
-
172
-
173
-
174
-
175
-
176
-
177
-
178
-
179
-
180
-
181
-
182
-
183
-
184
-
185
-
186
-
187
-
188
-
189
-
190
-
191
-
192
-
193
-
194
-
195
-
196
-
197
-
198
-
199
-
200
-
201
-
202
-
203
-
204
-
205
-
206
-
207
-
208
-
209
-
210
-
211
-
212
-
213
-
214
-
215
-
216
-
217
-
218
-
219
-
 220
220 -
 221
221 -
 222
222 -
 223
223 -
 224
224 -
 225
225 -
 226
226 -
 227
227 -
 228
228 -
 229
229 -
 230
230 -
 231
231 -
 232
232 -
 233
233 -
 234
234 -
 235
235 -
 236
236 -
 237
237 -
 238
238 -
 239
239 -
 240
240 -
241
-
242
-
243
-
244
-
245
-
246
-
247
-
248
-
249
-
250
-
251
-
252
 |
 |

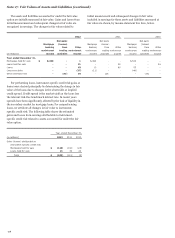
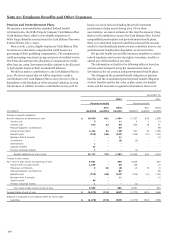
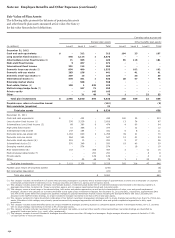
Note 20: Employee Benefits and Other Expenses (continued)
Amounts recognized in accumulated OCI (pre tax) consist of:
December 31,
2012 2011
Pension benefits Pension benefits
Non- Other Non- Other
(in millions) Qualified qualified benefits Qualified qualified benefits
Net actuarial loss $ 3,323 184 19 2,699 137 61
Net prior service credit (2) - (25) - - (27)
Net transition obligation - - 1 - - 1
Total $ 3,321 184 (5) 2,699 137 35
The net actuarial loss for the defined benefit pension plans
and other post retirement plans that will be amortized from
accumulated OCI into net periodic benefit cost in 2013 is
$182 million. The net prior service credit for the defined benefit
pension plans and other post retirement plans that will be
amortized from accumulated OCI into net periodic benefit cost
in 2013 is $2 million.
Plan Assumptions
For the years ended December 31, 2012 and 2011, the weighted-
average discount rate used to estimate the projected benefit
obligation for pension benefits (qualified and nonqualified) was
4.00% and 5.00%, respectively, and for other postretirement
benefits was 3.75% and 4.75%, respectively. For additional
information on our pension accounting assumptions, see Note 1.
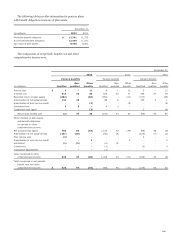
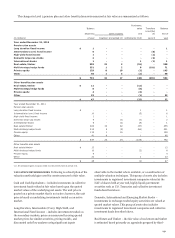
The weighted-average assumptions used to determine the net periodic benefit cost were:
December 31,
2012 2011 2010
Pension Other Pension Other Pension Other
benefits (1) benefits benefits (1) benefits benefits (1) benefits
Discount rate 5.00 % 4.75 5.25 5.25 5.75 5.75
Expected return on plan assets 7.50 6.00 8.25 6.00 8.25 8.25
(1) Includes both qualified and nonqualified pension benefits.
To account for postretirement health care plans we use
health care cost trend rates to recognize the effect of expected
changes in future health care costs due to medical inflation,
utilization changes, new technology, regulatory requirements
and Medicare cost shifting. In determining the end of year
benefit obligation we assume a range of average annual increases
of approximately 7.00% and 8.75%, dependent on plan type, for
health care costs in 2013. These rates are assumed to trend down
0.25% per year until the trend rate reaches an ultimate rate of
5.00% in 2020 through 2028, dependent on plan type. The 2012
periodic benefit cost was determined using initial annual trend
rates of 7.75%. These rates were assumed to decrease 0.25% per
year until they reached ultimate rates of 5.00% in 2023.
Increasing the assumed health care trend by one percentage
point in each year would increase the benefit obligation as of
December 31, 2012, by $58 million and the total of the interest
cost and service cost components of the net periodic benefit cost
for 2012 by $3 million. Decreasing the assumed health care
trend by one percentage point in each year would decrease the
benefit obligation as of December 31, 2012, by $52 million and
the total of the interest cost and service cost components of the
net periodic benefit cost for 2012 by $2 million.
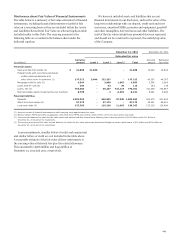
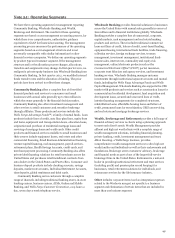
Investment Strategy and Asset Allocation
We seek to achieve the expected long-term rate of return with a
prudent level of risk given the benefit obligations of the pension
plans and their funded status. Our overall investment strategy is
designed to provide our Cash Balance Plan with a balance of
long-term growth opportunities and short-term benefit
strategies while ensuring that risk is mitigated through
diversification across numerous asset classes and various
investment strategies. We target the asset allocation for our Cash
Balance Plan at a target mix range of 35-55% equities, 35-55%
fixed income, and approximately 10% in real estate, venture
capital, private equity and other investments. The Employee
Benefit Review Committee (EBRC), which includes several
members of senior management, formally reviews the
investment risk and performance of our Cash Balance Plan on a
quarterly basis. Annual Plan liability analysis and periodic
asset/liability evaluations are also conducted.
Other benefit plan assets include (1) assets held in a 401(h)
trust, which are invested with a target mix of 40-60% for both
equities and fixed income, and (2) assets held in the Retiree
Medical Plan Voluntary Employees' Beneficiary Association
(VEBA) trust, which are invested with a general target asset mix
of 20-40% equities and 60-80% fixed income. In addition, the
strategy for the VEBA trust assets considers the effect of income
228