Wells Fargo 2012 Annual Report Download - page 167
Download and view the complete annual report
Please find page 167 of the 2012 Wells Fargo annual report below. You can navigate through the pages in the report by either clicking on the pages listed below, or by using the keyword search tool below to find specific information within the annual report.-
 1
1 -
2
-
3
-
4
-
5
-
6
-
7
-
8
-
9
-
10
-
11
-
12
-
13
-
14
-
15
-
16
-
17
-
18
-
19
-
20
-
21
-
22
-
23
-
24
-
25
-
26
-
27
-
28
-
29
-
30
-
31
-
32
-
33
-
34
-
35
-
36
-
37
-
38
-
39
-
40
-
41
-
42
-
43
-
44
-
45
-
46
-
47
-
48
-
49
-
50
-
51
-
52
-
53
-
54
-
55
-
56
-
57
-
58
-
59
-
60
-
61
-
62
-
63
-
64
-
65
-
66
-
67
-
68
-
69
-
70
-
71
-
72
-
73
-
74
-
75
-
76
-
77
-
78
-
79
-
80
-
81
-
82
-
83
-
84
-
85
-
86
-
87
-
88
-
89
-
90
-
91
-
92
-
93
-
94
-
95
-
96
-
97
-
98
-
99
-
100
-
101
-
102
-
103
-
104
-
105
-
106
-
107
-
108
-
109
-
110
-
111
-
112
-
113
-
114
-
115
-
116
-
117
-
118
-
119
-
120
-
121
-
122
-
123
-
124
-
125
-
126
-
127
-
128
-
129
-
130
-
131
-
132
-
133
-
134
-
135
-
136
-
137
-
138
-
139
-
140
-
141
-
142
-
143
-
144
-
145
-
146
-
147
-
148
-
149
-
150
-
151
-
152
-
153
-
154
-
155
-
156
-
 157
157 -
 158
158 -
 159
159 -
 160
160 -
 161
161 -
 162
162 -
 163
163 -
 164
164 -
 165
165 -
 166
166 -
 167
167 -
 168
168 -
 169
169 -
 170
170 -
 171
171 -
 172
172 -
 173
173 -
 174
174 -
 175
175 -
 176
176 -
 177
177 -
178
-
179
-
180
-
181
-
182
-
183
-
184
-
185
-
186
-
187
-
188
-
189
-
190
-
191
-
192
-
193
-
194
-
195
-
196
-
197
-
198
-
199
-
200
-
201
-
202
-
203
-
204
-
205
-
206
-
207
-
208
-
209
-
210
-
211
-
212
-
213
-
214
-
215
-
216
-
217
-
218
-
219
-
220
-
221
-
222
-
223
-
224
-
225
-
226
-
227
-
228
-
229
-
230
-
231
-
232
-
233
-
234
-
235
-
236
-
237
-
238
-
239
-
240
-
241
-
242
-
243
-
244
-
245
-
246
-
247
-
248
-
249
-
250
-
251
-
252
 |
 |

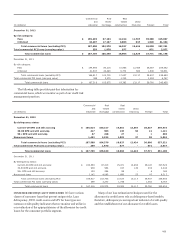
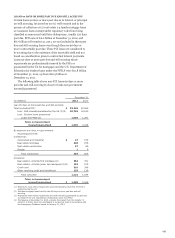
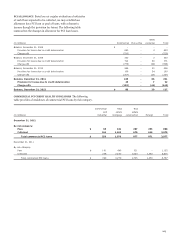
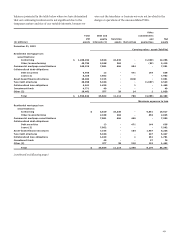
PCI ALLOWANCE Based on our regular evaluation of estimates
of cash flows expected to be collected, we may establish an
allowance for a PCI loan or pool of loans, with a charge to
income though the provision for losses. The following table
summarizes the changes in allowance for PCI loan losses.
Other
(in millions) Commercial Pick-a-Pay consumer Total
Balance, December 31, 2008 $ - - - -
Provision for losses due to credit deterioration 850 - 3 853
Charge-offs (520) - - (520)
Balance, December 31, 2009 330 - 3 333
Provision for losses due to credit deterioration 712 - 59 771
Charge-offs (776) - (30) (806)
Balance, December 31, 2010 266 - 32 298
Provision for losses due to credit deterioration 106 - 54 160
Charge-offs (207) - (20) (227)
Balance, December 31, 2011 165 - 66 231
Provision for losses due to credit deterioration 25 - 7 32
Charge-offs (102) - (44) (146)
Balance, December 31, 2012 $ 88 - 29 117
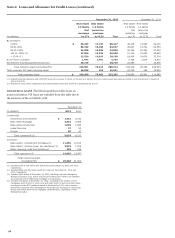
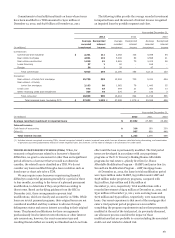
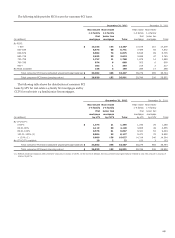
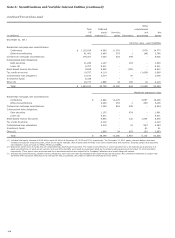
COMMERCIAL PCI CREDIT QUALITY INDICATORS The following
table provides a breakdown of commercial PCI loans by risk category.
Commercial Real Real
and estate estate
(in millions) industrial mortgage construction Foreign Total
December 31, 2012
By risk category:
Pass $ 95 341 207 255 898
Criticized 164 1,629 670 616 3,079
Total commercial PCI loans $ 259 1,970 877 871 3,977
December 31, 2011
By risk category:
Pass $ 191 640 321 - 1,152
Criticized 208 2,630 1,424 1,353 5,615
Total commercial PCI loans $ 399 3,270 1,745 1,353 6,767
165