Wells Fargo 2012 Annual Report Download - page 125
Download and view the complete annual report
Please find page 125 of the 2012 Wells Fargo annual report below. You can navigate through the pages in the report by either clicking on the pages listed below, or by using the keyword search tool below to find specific information within the annual report.-
 1
1 -
2
-
3
-
4
-
5
-
6
-
7
-
8
-
9
-
10
-
11
-
12
-
13
-
14
-
15
-
16
-
17
-
18
-
19
-
20
-
21
-
22
-
23
-
24
-
25
-
26
-
27
-
28
-
29
-
30
-
31
-
32
-
33
-
34
-
35
-
36
-
37
-
38
-
39
-
40
-
41
-
42
-
43
-
44
-
45
-
46
-
47
-
48
-
49
-
50
-
51
-
52
-
53
-
54
-
55
-
56
-
57
-
58
-
59
-
60
-
61
-
62
-
63
-
64
-
65
-
66
-
67
-
68
-
69
-
70
-
71
-
72
-
73
-
74
-
75
-
76
-
77
-
78
-
79
-
80
-
81
-
82
-
83
-
84
-
85
-
86
-
87
-
88
-
89
-
90
-
91
-
92
-
93
-
94
-
95
-
96
-
97
-
98
-
99
-
100
-
101
-
102
-
103
-
104
-
105
-
106
-
107
-
108
-
109
-
110
-
111
-
112
-
113
-
114
-
 115
115 -
 116
116 -
 117
117 -
 118
118 -
 119
119 -
 120
120 -
 121
121 -
 122
122 -
 123
123 -
 124
124 -
 125
125 -
 126
126 -
 127
127 -
 128
128 -
 129
129 -
 130
130 -
 131
131 -
 132
132 -
 133
133 -
 134
134 -
 135
135 -
136
-
137
-
138
-
139
-
140
-
141
-
142
-
143
-
144
-
145
-
146
-
147
-
148
-
149
-
150
-
151
-
152
-
153
-
154
-
155
-
156
-
157
-
158
-
159
-
160
-
161
-
162
-
163
-
164
-
165
-
166
-
167
-
168
-
169
-
170
-
171
-
172
-
173
-
174
-
175
-
176
-
177
-
178
-
179
-
180
-
181
-
182
-
183
-
184
-
185
-
186
-
187
-
188
-
189
-
190
-
191
-
192
-
193
-
194
-
195
-
196
-
197
-
198
-
199
-
200
-
201
-
202
-
203
-
204
-
205
-
206
-
207
-
208
-
209
-
210
-
211
-
212
-
213
-
214
-
215
-
216
-
217
-
218
-
219
-
220
-
221
-
222
-
223
-
224
-
225
-
226
-
227
-
228
-
229
-
230
-
231
-
232
-
233
-
234
-
235
-
236
-
237
-
238
-
239
-
240
-
241
-
242
-
243
-
244
-
245
-
246
-
247
-
248
-
249
-
250
-
251
-
252
 |
 |

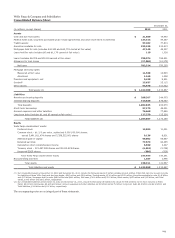
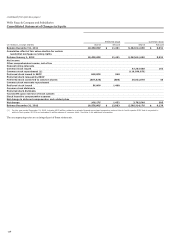
Wells Fargo & Company and Subsidiaries
Consolidated Balance Sheet
December 31,
(in millions, except shares) 2012 2011
Assets
Cash and due from banks $ 21,860 19,440
Federal funds sold, securities purchased under resale agreements and other short-term investments 137,313 44,367
Trading assets 57,482 77,814
Securities available for sale 235,199 222,613
Mortgages held for sale (includes $42,305 and $44,791 carried at fair value) 47,149 48,357
Loans held for sale (includes $6 and $1,176 carried at fair value) 110 1,338
Loans (includes $6,206 and $5,916 carried at fair value) 799,574 769,631
Allowance for loan losses (17,060) (19,372)
Net loans 782,514 750,259
Mortgage servicing rights:
Measured at fair value 11,538 12,603
Amortized 1,160 1,408
Premises and equipment, net 9,428 9,531
Goodwill 25,637 25,115
Other assets 93,578 101,022
Total assets (1) $ 1,422,968 1,313,867
Liabilities
Noninterest-bearing deposits $ 288,207 244,003
Interest-bearing deposits 714,628 676,067
Total deposits 1,002,835 920,070
Short-term borrowings 57,175 49,091
Accrued expenses and other liabilities 76,668 77,665
Long-term debt (includes $1 and $0 carried at fair value) 127,379 125,354
Total liabilities (2) 1,264,057 1,172,180
Equity
Wells Fargo stockholders' equity:
Preferred stock 12,883 11,431
Common stock – $1-2/3 par value, authorized 9,000,000,000 shares;
issued 5,481,811,474 shares and 5,358,522,061 shares 9,136 8,931
Additional paid-in capital 59,802 55,957
Retained earnings 77,679 64,385
Cumulative other comprehensive income 5,650 3,207
Treasury stock – 215,497,298 shares and 95,910,425 shares (6,610) (2,744)
Unearned ESOP shares (986) (926)
Total Wells Fargo stockholders' equity 157,554 140,241
Noncontrolling interests 1,357 1,446
Total equity 158,911 141,687
Total liabilities and equity $ 1,422,968 1,313,867
(1) Our consolidated assets at December 31, 2012 and December 31, 2011, include the following assets of certain variable interest entities (VIEs) that can only be used to settle
the liabilities of those VIEs: Cash and due from banks, $260 million and $321 million; Trading assets, $114 million and $293 million; Securities available for sale, $2.8 billion
and $3.3 billion; Mortgages held for sale, $469 million and $444 million; Net loans, $10.6 billion and $12.0 billion; Other assets, $457 million and $1.9 billion, and Total
assets, $14.6 billion and $18.2 billion, respectively.
(2) Our consolidated liabilities at December 31, 2012 and December 31, 2011, include the following VIE liabilities for which the VIE creditors do not have recourse to Wells
Fargo: Short-term borrowings, $0 and $24 million; Accrued expenses and other liabilities, $134 million and $175 million; Long-term debt, $3.5 billion and $4.9 billion; and
Total liabilities, $3.6 billion and $5.1 billion, respectively.
The accompanying notes are an integral part of these statements.
123