Wells Fargo 2012 Annual Report Download - page 237
Download and view the complete annual report
Please find page 237 of the 2012 Wells Fargo annual report below. You can navigate through the pages in the report by either clicking on the pages listed below, or by using the keyword search tool below to find specific information within the annual report.-
 1
1 -
2
-
3
-
4
-
5
-
6
-
7
-
8
-
9
-
10
-
11
-
12
-
13
-
14
-
15
-
16
-
17
-
18
-
19
-
20
-
21
-
22
-
23
-
24
-
25
-
26
-
27
-
28
-
29
-
30
-
31
-
32
-
33
-
34
-
35
-
36
-
37
-
38
-
39
-
40
-
41
-
42
-
43
-
44
-
45
-
46
-
47
-
48
-
49
-
50
-
51
-
52
-
53
-
54
-
55
-
56
-
57
-
58
-
59
-
60
-
61
-
62
-
63
-
64
-
65
-
66
-
67
-
68
-
69
-
70
-
71
-
72
-
73
-
74
-
75
-
76
-
77
-
78
-
79
-
80
-
81
-
82
-
83
-
84
-
85
-
86
-
87
-
88
-
89
-
90
-
91
-
92
-
93
-
94
-
95
-
96
-
97
-
98
-
99
-
100
-
101
-
102
-
103
-
104
-
105
-
106
-
107
-
108
-
109
-
110
-
111
-
112
-
113
-
114
-
115
-
116
-
117
-
118
-
119
-
120
-
121
-
122
-
123
-
124
-
125
-
126
-
127
-
128
-
129
-
130
-
131
-
132
-
133
-
134
-
135
-
136
-
137
-
138
-
139
-
140
-
141
-
142
-
143
-
144
-
145
-
146
-
147
-
148
-
149
-
150
-
151
-
152
-
153
-
154
-
155
-
156
-
157
-
158
-
159
-
160
-
161
-
162
-
163
-
164
-
165
-
166
-
167
-
168
-
169
-
170
-
171
-
172
-
173
-
174
-
175
-
176
-
177
-
178
-
179
-
180
-
181
-
182
-
183
-
184
-
185
-
186
-
187
-
188
-
189
-
190
-
191
-
192
-
193
-
194
-
195
-
196
-
197
-
198
-
199
-
200
-
201
-
202
-
203
-
204
-
205
-
206
-
207
-
208
-
209
-
210
-
211
-
212
-
213
-
214
-
215
-
216
-
217
-
218
-
219
-
220
-
221
-
222
-
223
-
224
-
225
-
226
-
 227
227 -
 228
228 -
 229
229 -
 230
230 -
 231
231 -
 232
232 -
 233
233 -
 234
234 -
 235
235 -
 236
236 -
 237
237 -
 238
238 -
 239
239 -
 240
240 -
 241
241 -
 242
242 -
 243
243 -
 244
244 -
 245
245 -
 246
246 -
 247
247 -
248
-
249
-
250
-
251
-
252
 |
 |

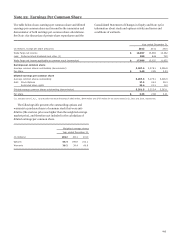
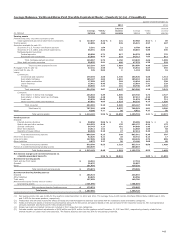
Note 22: Earnings Per Common Share
The table below shows earnings per common share and diluted
earnings per common share and reconciles the numerator and
denominator of both earnings per common share calculations.
See Note 1 for discussion of private share repurchases and the
Consolidated Statement of Changes in Equity and Note 19 for
information about stock and options activity and terms and
conditions of warrants.
Year ended December 31,
(in millions, except per share amounts) 2012 2011 2010
Wells Fargo net income $ 18,897 15,869 12,362
Less: Preferred stock dividends and other (1) 898 844 730
Wells Fargo net income applicable to common stock (numerator) $ 17,999 15,025 11,632
Earnings per common share
Average common shares outstanding (denominator) 5,287.6 5,278.1 5,226.8
Per share $ 3.40 2.85 2.23
Diluted earnings per common share
Average common shares outstanding 5,287.6 5,278.1 5,226.8
Add: Stock Options 27.5 24.2 28.3
Restricted share rights 36.4 21.1 8.0
Diluted average common shares outstanding (denominator) 5,351.5 5,323.4 5,263.1
Per share $ 3.36 2.82 2.21
(1) Includes series J, K, L, I and N preferred stock dividends of $892 million, $844 million and $737 million for the years ended 2012, 2011 and 2010, respectively.
The following table presents the outstanding options and
warrants to purchase shares of common stock that were anti-
dilutive (the exercise price was higher than the weighted-average
market price), and therefore not included in the calculation of
diluted earnings per common share.
Weighted-average shares
Year ended December 31,
(in millions) 2012 2011 2010
Options 56.4 198.8 212.1
Warrants 39.2 39.4 66.9
235