Wells Fargo 2012 Annual Report Download - page 145
Download and view the complete annual report
Please find page 145 of the 2012 Wells Fargo annual report below. You can navigate through the pages in the report by either clicking on the pages listed below, or by using the keyword search tool below to find specific information within the annual report.-
 1
1 -
2
-
3
-
4
-
5
-
6
-
7
-
8
-
9
-
10
-
11
-
12
-
13
-
14
-
15
-
16
-
17
-
18
-
19
-
20
-
21
-
22
-
23
-
24
-
25
-
26
-
27
-
28
-
29
-
30
-
31
-
32
-
33
-
34
-
35
-
36
-
37
-
38
-
39
-
40
-
41
-
42
-
43
-
44
-
45
-
46
-
47
-
48
-
49
-
50
-
51
-
52
-
53
-
54
-
55
-
56
-
57
-
58
-
59
-
60
-
61
-
62
-
63
-
64
-
65
-
66
-
67
-
68
-
69
-
70
-
71
-
72
-
73
-
74
-
75
-
76
-
77
-
78
-
79
-
80
-
81
-
82
-
83
-
84
-
85
-
86
-
87
-
88
-
89
-
90
-
91
-
92
-
93
-
94
-
95
-
96
-
97
-
98
-
99
-
100
-
101
-
102
-
103
-
104
-
105
-
106
-
107
-
108
-
109
-
110
-
111
-
112
-
113
-
114
-
115
-
116
-
117
-
118
-
119
-
120
-
121
-
122
-
123
-
124
-
125
-
126
-
127
-
128
-
129
-
130
-
131
-
132
-
133
-
134
-
 135
135 -
 136
136 -
 137
137 -
 138
138 -
 139
139 -
 140
140 -
 141
141 -
 142
142 -
 143
143 -
 144
144 -
 145
145 -
 146
146 -
 147
147 -
 148
148 -
 149
149 -
 150
150 -
 151
151 -
 152
152 -
 153
153 -
 154
154 -
 155
155 -
156
-
157
-
158
-
159
-
160
-
161
-
162
-
163
-
164
-
165
-
166
-
167
-
168
-
169
-
170
-
171
-
172
-
173
-
174
-
175
-
176
-
177
-
178
-
179
-
180
-
181
-
182
-
183
-
184
-
185
-
186
-
187
-
188
-
189
-
190
-
191
-
192
-
193
-
194
-
195
-
196
-
197
-
198
-
199
-
200
-
201
-
202
-
203
-
204
-
205
-
206
-
207
-
208
-
209
-
210
-
211
-
212
-
213
-
214
-
215
-
216
-
217
-
218
-
219
-
220
-
221
-
222
-
223
-
224
-
225
-
226
-
227
-
228
-
229
-
230
-
231
-
232
-
233
-
234
-
235
-
236
-
237
-
238
-
239
-
240
-
241
-
242
-
243
-
244
-
245
-
246
-
247
-
248
-
249
-
250
-
251
-
252
 |
 |
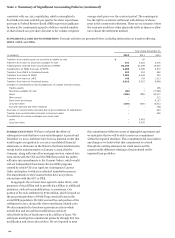
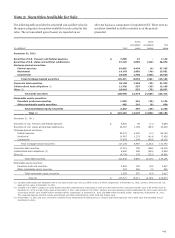
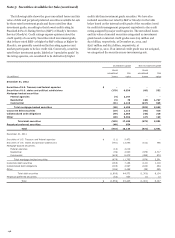
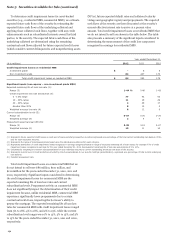
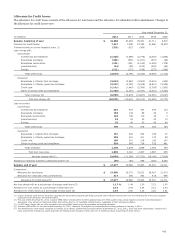
Note 5: Securities Available for Sale
The following table provides the amortized cost and fair value for
the major categories of securities available for sale carried at fair
value. The net unrealized gains (losses) are reported on an
after-tax basis as a component of cumulative OCI. There were no
securities classified as held to maturity as of the periods
presented.
Gross Gross
unrealized unrealized Fair
(in millions) Cost gains losses value
December 31, 2012
Securities of U.S. Treasury and federal agencies $ 7,099 47 - 7,146
Securities of U.S. states and political subdivisions 37,120 2,000 (444) 38,676
Mortgage-backed securities:
Federal agencies 92,855 4,434 (4) 97,285
Residential 14,178 1,802 (49) 15,931
Commercial 18,438 1,798 (268) 19,968
Total mortgage-backed securities 125,471 8,034 (321) 133,184
Corporate debt securities 20,120 1,282 (69) 21,333
Collateralized debt obligations (1) 12,726 557 (95) 13,188
Other (2) 18,410 553 (76) 18,887
Total debt securities 220,946 12,473 (1,005) 232,414
Marketable equity securities:
Perpetual preferred securities 1,935 281 (40) 2,176
Other marketable equity securities 402 216 (9) 609
Total marketable equity securities 2,337 497 (49) 2,785
Total (3) $ 223,283 12,970 (1,054) 235,199
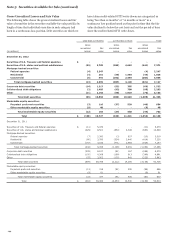
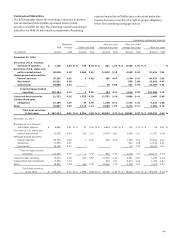
December 31, 2011
Securities of U.S. Treasury and federal agencies $ 6,920 59 (11) 6,968
Securities of U.S. states and political subdivisions 32,307 1,169 (883) 32,593
Mortgage-backed securities:
Federal agencies 92,279 4,485 (10) 96,754
Residential 16,997 1,253 (414) 17,836
Commercial 17,829 1,249 (928) 18,150
Total mortgage-backed securities 127,105 6,987 (1,352) 132,740
Corporate debt securities 17,921 769 (286) 18,404
Collateralized debt obligations (1) 8,650 298 (349) 8,599
Other (2) 19,739 378 (225) 19,892
Total debt securities 212,642 9,660 (3,106) 219,196
Marketable equity securities:
Perpetual preferred securities 2,396 185 (54) 2,527
Other marketable equity securities 533 366 (9) 890
Total marketable equity securities 2,929 551 (63) 3,417
Total (3) $ 215,571 10,211 (3,169) 222,613
(1) Includes collateralized loan obligations with a cost basis and fair value of $12.2 billion and $12.5 billion, respectively, at December 31, 2012, and $8.1 billion for both cost
basis and fair value, at December 31, 2011.
(2) Included in the “Other” category are asset-backed securities collateralized by auto leases or loans and cash reserves with a cost basis and fair value of $5.9 billion each at
December 31, 2012, and $6.7 billion each at December 31, 2011. Also included in the "Other" category are asset-backed securities collateralized by home equity loans with
a cost basis and fair value of $695 million and $918 million, respectively, at December 31, 2012, and $846 million and $932 million, respectively, at December 31, 2011.
The remaining balances primarily include asset-backed securities collateralized by credit cards and student loans.
(3) At December 31, 2012 and 2011, we held no securities of any single issuer (excluding the U.S. Treasury and federal agencies) with a book value that exceeded 10% of
stockholders’ equity.
143