Wells Fargo 2012 Annual Report Download - page 49
Download and view the complete annual report
Please find page 49 of the 2012 Wells Fargo annual report below. You can navigate through the pages in the report by either clicking on the pages listed below, or by using the keyword search tool below to find specific information within the annual report.-
 1
1 -
2
-
3
-
4
-
5
-
6
-
7
-
8
-
9
-
10
-
11
-
12
-
13
-
14
-
15
-
16
-
17
-
18
-
19
-
20
-
21
-
22
-
23
-
24
-
25
-
26
-
27
-
28
-
29
-
30
-
31
-
32
-
33
-
34
-
35
-
36
-
37
-
38
-
 39
39 -
 40
40 -
 41
41 -
 42
42 -
 43
43 -
 44
44 -
 45
45 -
 46
46 -
 47
47 -
 48
48 -
 49
49 -
 50
50 -
 51
51 -
 52
52 -
 53
53 -
 54
54 -
 55
55 -
 56
56 -
 57
57 -
 58
58 -
 59
59 -
60
-
61
-
62
-
63
-
64
-
65
-
66
-
67
-
68
-
69
-
70
-
71
-
72
-
73
-
74
-
75
-
76
-
77
-
78
-
79
-
80
-
81
-
82
-
83
-
84
-
85
-
86
-
87
-
88
-
89
-
90
-
91
-
92
-
93
-
94
-
95
-
96
-
97
-
98
-
99
-
100
-
101
-
102
-
103
-
104
-
105
-
106
-
107
-
108
-
109
-
110
-
111
-
112
-
113
-
114
-
115
-
116
-
117
-
118
-
119
-
120
-
121
-
122
-
123
-
124
-
125
-
126
-
127
-
128
-
129
-
130
-
131
-
132
-
133
-
134
-
135
-
136
-
137
-
138
-
139
-
140
-
141
-
142
-
143
-
144
-
145
-
146
-
147
-
148
-
149
-
150
-
151
-
152
-
153
-
154
-
155
-
156
-
157
-
158
-
159
-
160
-
161
-
162
-
163
-
164
-
165
-
166
-
167
-
168
-
169
-
170
-
171
-
172
-
173
-
174
-
175
-
176
-
177
-
178
-
179
-
180
-
181
-
182
-
183
-
184
-
185
-
186
-
187
-
188
-
189
-
190
-
191
-
192
-
193
-
194
-
195
-
196
-
197
-
198
-
199
-
200
-
201
-
202
-
203
-
204
-
205
-
206
-
207
-
208
-
209
-
210
-
211
-
212
-
213
-
214
-
215
-
216
-
217
-
218
-
219
-
220
-
221
-
222
-
223
-
224
-
225
-
226
-
227
-
228
-
229
-
230
-
231
-
232
-
233
-
234
-
235
-
236
-
237
-
238
-
239
-
240
-
241
-
242
-
243
-
244
-
245
-
246
-
247
-
248
-
249
-
250
-
251
-
252
 |
 |

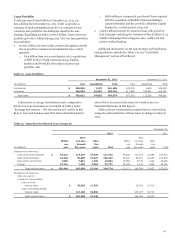
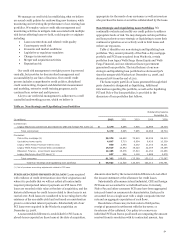
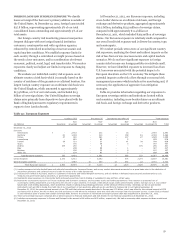
Loan Portfolio
Total loans were $799.6 billion at December 31, 2012, up
$29.9 billion from December 31, 2011. Table 12 provides a
summary of total outstanding loans for our commercial and
consumer loan portfolios. Excluding the runoff in the non-
strategic/liquidating portfolios of $17.8 billion, loans in the core
portfolio grew $47.7 billion during 2012. Our core loan growth in
2012 included:
x an $18.3 billion increase in the commercial segment, mostly
due to growth in commercial and industrial loans, which
included:
o $6.9 billion from our second quarter 2012 acquisitions
of BNP Paribas’ North American energy lending
business and WestLB’s subscription finance loan
portfolio; and
o $858 million of commercial asset-based loans acquired
with the acquisition of Burdale Financial Holdings
Limited (Burdale) and the portfolio of Burdale Capital
Finance Inc. in first quarter 2012; and
x a $29.4 billion increase in consumer loans with growth in
first mortgage (including the retention of $19.4 billion of 1-4
family conforming first mortgages), auto, credit card and
private student lending.
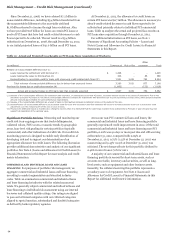
Additional information on the non-strategic and liquidating
loan portfolios is included in Table 17 in the “Credit Risk
Management” section of this Report.
Table 12: Loan Portfolios
December 31, 2012 December 31, 2011
(in millions) Core Liquidating Total Core Liquidating Total
Commercial $ 358,028 3,170 361,198 339,755 5,695 345,450
Consumer 346,984 91,392 438,376 317,550 106,631 424,181
Total loans $ 705,012 94,562 799,574 657,305 112,326 769,631
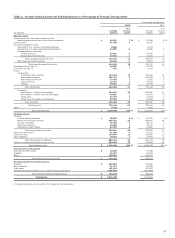
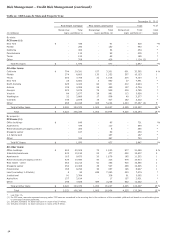
A discussion of average loan balances and a comparative
detail of average loan balances is included in Table 5 under
“Earnings Performance – Net Interest Income” earlier in this
Report. Year-end balances and other loan related information
are in Note 6 (Loans and Allowance for Credit Losses) to
Financial Statements in this Report.
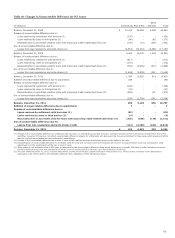
Table 13 shows contractual loan maturities for selected loan
categories and sensitivities of those loans to changes in interest
rates.
Table 13: Maturities for Selected Loan Categories
December 31,
2012 2011
After After
Within one year After Within one year After
one through five one through five
(in millions) year five years years Total year five years years Total
Selected loan maturities:
Commercial and industrial $ 45,212 123,578 18,969 187,759 44,258 101,273 21,685 167,216
Real estate mortgage 22,328 56,085 27,927 106,340 22,537 54,201 29,237 105,975
Real estate construction 7,685 7,961 1,258 16,904 10,059 8,178 1,145 19,382
Foreign 27,219 7,460 3,092 37,771 35,258 3,142 1,360 39,760
Total selected loans $ 102,444 195,084 51,246 348,774 112,112 166,794 53,427 332,333
Distribution of loans due
after one year to
changes in interest rates:
Loans at fixed
interest rates $ 20,894 11,387 19,319 13,712
Loans at floating/variable
interest rates 174,190 39,859 147,475 39,715
Total selected loans $ 195,084 51,246 166,794 53,427
47