Wells Fargo 2012 Annual Report Download - page 213
Download and view the complete annual report
Please find page 213 of the 2012 Wells Fargo annual report below. You can navigate through the pages in the report by either clicking on the pages listed below, or by using the keyword search tool below to find specific information within the annual report.-
 1
1 -
2
-
3
-
4
-
5
-
6
-
7
-
8
-
9
-
10
-
11
-
12
-
13
-
14
-
15
-
16
-
17
-
18
-
19
-
20
-
21
-
22
-
23
-
24
-
25
-
26
-
27
-
28
-
29
-
30
-
31
-
32
-
33
-
34
-
35
-
36
-
37
-
38
-
39
-
40
-
41
-
42
-
43
-
44
-
45
-
46
-
47
-
48
-
49
-
50
-
51
-
52
-
53
-
54
-
55
-
56
-
57
-
58
-
59
-
60
-
61
-
62
-
63
-
64
-
65
-
66
-
67
-
68
-
69
-
70
-
71
-
72
-
73
-
74
-
75
-
76
-
77
-
78
-
79
-
80
-
81
-
82
-
83
-
84
-
85
-
86
-
87
-
88
-
89
-
90
-
91
-
92
-
93
-
94
-
95
-
96
-
97
-
98
-
99
-
100
-
101
-
102
-
103
-
104
-
105
-
106
-
107
-
108
-
109
-
110
-
111
-
112
-
113
-
114
-
115
-
116
-
117
-
118
-
119
-
120
-
121
-
122
-
123
-
124
-
125
-
126
-
127
-
128
-
129
-
130
-
131
-
132
-
133
-
134
-
135
-
136
-
137
-
138
-
139
-
140
-
141
-
142
-
143
-
144
-
145
-
146
-
147
-
148
-
149
-
150
-
151
-
152
-
153
-
154
-
155
-
156
-
157
-
158
-
159
-
160
-
161
-
162
-
163
-
164
-
165
-
166
-
167
-
168
-
169
-
170
-
171
-
172
-
173
-
174
-
175
-
176
-
177
-
178
-
179
-
180
-
181
-
182
-
183
-
184
-
185
-
186
-
187
-
188
-
189
-
190
-
191
-
192
-
193
-
194
-
195
-
196
-
197
-
198
-
199
-
200
-
201
-
202
-
 203
203 -
 204
204 -
 205
205 -
 206
206 -
 207
207 -
 208
208 -
 209
209 -
 210
210 -
 211
211 -
 212
212 -
 213
213 -
 214
214 -
 215
215 -
 216
216 -
 217
217 -
 218
218 -
 219
219 -
 220
220 -
 221
221 -
 222
222 -
 223
223 -
224
-
225
-
226
-
227
-
228
-
229
-
230
-
231
-
232
-
233
-
234
-
235
-
236
-
237
-
238
-
239
-
240
-
241
-
242
-
243
-
244
-
245
-
246
-
247
-
248
-
249
-
250
-
251
-
252
 |
 |

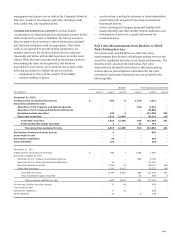
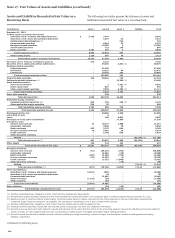
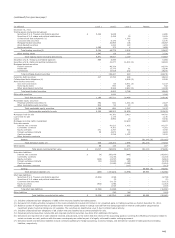
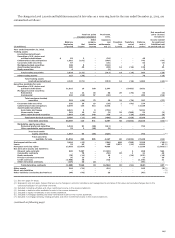
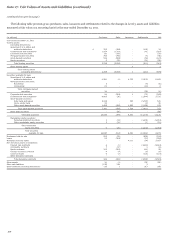
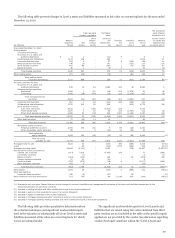
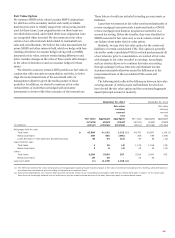
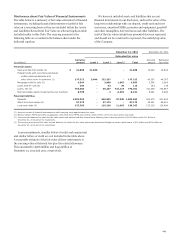
The following table presents changes in Level 3 assets and liabilities measured at fair value on a recurring basis for the year ended
December 31, 2010.
Net unrealized
Total net gains Purchases, gains (losses)
(losses) included in sales, included in net
Other issuances income related
Balance, compre- and Transfers Transfers Balance, to assets and
beginning Net hensive settlements, into out of end of liabilities held
(in millions) of yea
r
income income net Level 3 Level 3 year at period end (1)
Year ended December 31, 2010
Trading assets
(excluding derivatives):
Securities of U.S. states and
political subdivisions $ 5 2 - (11) 9 - 5 1
Collateralized debt obligations 1,133 418 - 364 - - 1,915 11
Corporate debt securities 223 9 - 67 9 (142) 166 16
Mortgage-backed securities 146 (7) - 101 - (123) 117 (17)
Asset-backed securities 497 80 - (141) 1 (71) 366 67
Equity securities 36 1 - (5) 2 - 34 (2)
Total trading securities 2,040 503 - 375 21 (336) 2,603 76
Other trading assets 271 (35) - (19) - (81) 136 10
Total trading assets
(excluding derivatives) 2,311 468 - 356 21 (417) 2,739 86 (2)
Securities available for sale:
Securities of U.S. states and
political subdivisions 818 12 63 3,485 192 (6) 4,564 4
Mortgage-backed securities:
Residential 1,084 7 (21) (48) 274 (1,276) 20 (8)
Commercial 1,799 (28) 404 (10) 227 (2,175) 217 (5)
Total mortgage-backed
securities 2,883 (21) 383 (58) 501 (3,451) 237 (13)
Corporate debt securities 367 7 68 (113) 259 (155) 433 -
Collateralized debt obligations 3,725 210 96 959 - (212) 4,778 (14)
Asset-backed securities:
Auto loans and leases 8,525 1 (246) (2,403) 256 - 6,133 -
Home equity loans 1,677 1 40 48 113 (1,767) 112 (5)
Other asset-backed securities 2,308 51 (19) 903 1,057 (1,150) 3,150 (12)
Total asset-backed securities 12,510 53 (225) (1,452) 1,426 (2,917) 9,395 (17)
Other debt securities 77 (15) 11 12 - - 85 -
Total debt securities 20,380 246 396 2,833 2,378 (6,741) 19,492 (40)(3)
Marketable equity securities:
Perpetual preferred securities 2,305 100 (31) 6 80 (26) 2,434 -
Other marketable equity securities 88 - 5 (21) 14 (54) 32 -
Total marketable
equity securities 2,393 100 (26) (15) 94 (80) 2,466 - (4)
Total securities
available for sale 22,773 346 370 2,818 2,472 (6,821) 21,958 (40)
Mortgages held for sale 3,523 43 - (253) 380 (388) 3,305 39 (5)
Loans - 55 - (112) 1,035 (669) 309 55 (5)
Mortgage servicing rights 16,004 (5,511) - 4,092 - (118) 14,467 (2,957)(5)
Net derivative assets and liabilities:
Interest rate contracts
(
114
)
3,514 - (3,482) 159 - 77 (266)
Commodity contracts - (1) - - - - (1) (1)
Equity contracts (344) (104) - 169 - 54 (225) (19)
Foreign exchange contracts (1) 21 - (11) - - 9 -
Credit contracts (330) (675) - (18) 6 - (1,017) (644)
Other derivative contracts
(
43
)
4 - 4 - - (35) -
Total derivative contracts (832) 2,759 - (3,338) 165 54 (1,192) (930)(6)
Other assets 1,373 29 - (103) 4 (989) 314 (38)(2)
Short sale liabilities
(corporate debt securities) (26) (2) - (37) - 65 - - (2)
Other liabilities (excluding derivatives) (10) (55) - 94 (1,038) 665 (344) (58)(5)
(1) Represents only net gains (losses) that are due to changes in economic conditions and management’s estimates of fair value and excludes changes due to the
collection/realization of cash flows over time.
(2) Included in trading activities and other noninterest income in the income statement.
(3) Included in debt securities available for sale in the income statement.
(4) Included in equity investments in the income statement.
(5) Included in mortgage banking and other noninterest income in the income statement.
(6) Included in mortgage banking, trading activities and other noninterest income in the income statement.
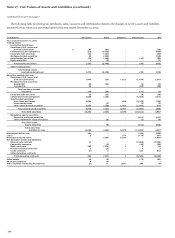
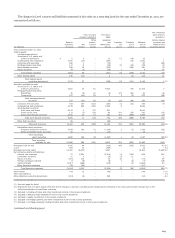
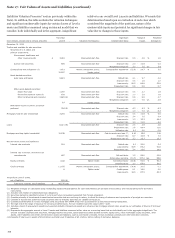
The following table provides quantitative information about
the valuation techniques and significant unobservable inputs
used in the valuation of substantially all of our Level 3 assets and
liabilities measured at fair value on a recurring basis for which
we use an internal model.
The significant unobservable inputs for Level 3 assets and
liabilities that are valued using fair values obtained from third
party vendors are not included in the table as the specific inputs
applied are not provided by the vendor (see discussion regarding
vendor-developed valuations within the “Level 3 Asset and
211