Wells Fargo 2012 Annual Report Download - page 83
Download and view the complete annual report
Please find page 83 of the 2012 Wells Fargo annual report below. You can navigate through the pages in the report by either clicking on the pages listed below, or by using the keyword search tool below to find specific information within the annual report.-
 1
1 -
2
-
3
-
4
-
5
-
6
-
7
-
8
-
9
-
10
-
11
-
12
-
13
-
14
-
15
-
16
-
17
-
18
-
19
-
20
-
21
-
22
-
23
-
24
-
25
-
26
-
27
-
28
-
29
-
30
-
31
-
32
-
33
-
34
-
35
-
36
-
37
-
38
-
39
-
40
-
41
-
42
-
43
-
44
-
45
-
46
-
47
-
48
-
49
-
50
-
51
-
52
-
53
-
54
-
55
-
56
-
57
-
58
-
59
-
60
-
61
-
62
-
63
-
64
-
65
-
66
-
67
-
68
-
69
-
70
-
71
-
72
-
 73
73 -
 74
74 -
 75
75 -
 76
76 -
 77
77 -
 78
78 -
 79
79 -
 80
80 -
 81
81 -
 82
82 -
 83
83 -
 84
84 -
 85
85 -
 86
86 -
 87
87 -
 88
88 -
 89
89 -
 90
90 -
 91
91 -
 92
92 -
 93
93 -
94
-
95
-
96
-
97
-
98
-
99
-
100
-
101
-
102
-
103
-
104
-
105
-
106
-
107
-
108
-
109
-
110
-
111
-
112
-
113
-
114
-
115
-
116
-
117
-
118
-
119
-
120
-
121
-
122
-
123
-
124
-
125
-
126
-
127
-
128
-
129
-
130
-
131
-
132
-
133
-
134
-
135
-
136
-
137
-
138
-
139
-
140
-
141
-
142
-
143
-
144
-
145
-
146
-
147
-
148
-
149
-
150
-
151
-
152
-
153
-
154
-
155
-
156
-
157
-
158
-
159
-
160
-
161
-
162
-
163
-
164
-
165
-
166
-
167
-
168
-
169
-
170
-
171
-
172
-
173
-
174
-
175
-
176
-
177
-
178
-
179
-
180
-
181
-
182
-
183
-
184
-
185
-
186
-
187
-
188
-
189
-
190
-
191
-
192
-
193
-
194
-
195
-
196
-
197
-
198
-
199
-
200
-
201
-
202
-
203
-
204
-
205
-
206
-
207
-
208
-
209
-
210
-
211
-
212
-
213
-
214
-
215
-
216
-
217
-
218
-
219
-
220
-
221
-
222
-
223
-
224
-
225
-
226
-
227
-
228
-
229
-
230
-
231
-
232
-
233
-
234
-
235
-
236
-
237
-
238
-
239
-
240
-
241
-
242
-
243
-
244
-
245
-
246
-
247
-
248
-
249
-
250
-
251
-
252
 |
 |
x to convert the cash flows from selected asset and/or liability
instruments/portfolios from fixed-rate payments to
floating-rate payments or vice versa; and
x to economically hedge our mortgage origination pipeline,
funded mortgage loans and MSRs using interest rate swaps,
swaptions, futures, forwards and options.
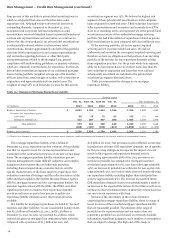
MORTGAGE BANKING INTEREST RATE AND MARKET RISK We
originate, fund and service mortgage loans, which subjects us to
various risks, including credit, liquidity and interest rate risks.
Based on market conditions and other factors, we reduce credit
and liquidity risks by selling or securitizing some or all of the
long-term fixed-rate mortgage loans we originate and most of
the ARMs we originate. On the other hand, we may hold
originated ARMs and fixed-rate mortgage loans in our loan
portfolio as an investment for our growing base of core deposits.
We determine whether the loans will be held for investment or
held for sale at the time of commitment. We may subsequently
change our intent to hold loans for investment and sell some or
all of our ARMs or fixed-rate mortgages as part of our corporate
asset/liability management. We may also acquire and add to our
securities available for sale a portion of the securities issued at
the time we securitize MHFS.
Notwithstanding the continued downturn in the housing
sector, and the continued lack of liquidity in the nonconforming
secondary markets, our mortgage banking revenue remained
strong, reflecting the complementary origination and servicing
strengths of the business. The secondary market for agency-
conforming mortgages functioned well during 2012.
Interest rate and market risk can be substantial in the
mortgage business. Changes in interest rates may potentially
reduce total origination and servicing fees, the value of our
residential MSRs measured at fair value, the value of MHFS and
the associated income and loss reflected in mortgage banking
noninterest income, the income and expense associated with
instruments (economic hedges) used to hedge changes in the fair
value of MSRs and MHFS, and the value of derivative loan
commitments (interest rate “locks”) extended to mortgage
applicants.
Interest rates affect the amount and timing of origination and
servicing fees because consumer demand for new mortgages and
the level of refinancing activity are sensitive to changes in
mortgage interest rates. Typically, a decline in mortgage interest
rates will lead to an increase in mortgage originations and fees
and may also lead to an increase in servicing fee income,
depending on the level of new loans added to the servicing
portfolio and prepayments. Given the time it takes for consumer
behavior to fully react to interest rate changes, as well as the
time required for processing a new application, providing the
commitment, and securitizing and selling the loan, interest rate
changes will affect origination and servicing fees with a lag. The
amount and timing of the impact on origination and servicing
fees will depend on the magnitude, speed and duration of the
change in interest rates.
We measure MHFS at fair value for prime MHFS
originations for which an active secondary market and readily
available market prices exist to reliably support fair value pricing
models used for these loans. Loan origination fees on these loans
are recorded when earned, and related direct loan origination
costs are recognized when incurred. We also measure at fair
value certain of our other interests held related to residential
loan sales and securitizations. We believe fair value
measurement for prime MHFS and other interests held, which
we hedge with free-standing derivatives (economic hedges)
along with our MSRs measured at fair value, reduces certain
timing differences and better matches changes in the value of
these assets with changes in the value of derivatives used as
economic hedges for these assets. During 2012 and 2011, in
response to continued secondary market illiquidity, we
continued to originate certain prime non-agency loans to be held
for investment for the foreseeable future rather than to be held
for sale. In addition, in 2012 and 2011, we originated certain
prime agency-eligible loans to be held for investment as part of
our asset/liability management strategy.
We initially measure all of our MSRs at fair value and carry
substantially all of them at fair value depending on our strategy
for managing interest rate risk. Under this method, the MSRs
are recorded at fair value at the time we sell or securitize the
related mortgage loans. The carrying value of MSRs carried at
fair value reflects changes in fair value at the end of each quarter
and changes are included in net servicing income, a component
of mortgage banking noninterest income. If the fair value of the
MSRs increases, income is recognized; if the fair value of the
MSRs decreases, a loss is recognized. We use a dynamic and
sophisticated model to estimate the fair value of our MSRs and
periodically benchmark our estimates to independent appraisals.
The valuation of MSRs can be highly subjective and involve
complex judgments by management about matters that are
inherently unpredictable. See “Critical Accounting Policies –
Valuation of Residential Mortgage Servicing Rights” section of
this Report for additional information. Changes in interest rates
influence a variety of significant assumptions included in the
periodic valuation of MSRs, including prepayment speeds,
expected returns and potential risks on the servicing asset
portfolio, the value of escrow balances and other servicing
valuation elements.
A decline in interest rates generally increases the propensity
for refinancing, reduces the expected duration of the servicing
portfolio and therefore reduces the estimated fair value of MSRs.
This reduction in fair value causes a charge to income for MSRs
carried at fair value, net of any gains on free-standing derivatives
(economic hedges) used to hedge MSRs. We may choose not to
fully hedge all the potential decline in the value of our MSRs
resulting from a decline in interest rates because the potential
increase in origination/servicing fees in that scenario provides a
partial “natural business hedge.” An increase in interest rates
generally reduces the propensity for refinancing, extends the
expected duration of the servicing portfolio and therefore
increases the estimated fair value of the MSRs. However, an
increase in interest rates can also reduce mortgage loan demand
and therefore reduce origination income.
The price risk associated with our MSRs is economically
hedged with a combination of highly liquid interest rate forward
instruments including mortgage forward contracts, interest rate
swaps and interest rate options. All of the instruments included
in the hedge are marked to market daily. Because the hedging
81