Wells Fargo 2012 Annual Report Download - page 170
Download and view the complete annual report
Please find page 170 of the 2012 Wells Fargo annual report below. You can navigate through the pages in the report by either clicking on the pages listed below, or by using the keyword search tool below to find specific information within the annual report.-
 1
1 -
2
-
3
-
4
-
5
-
6
-
7
-
8
-
9
-
10
-
11
-
12
-
13
-
14
-
15
-
16
-
17
-
18
-
19
-
20
-
21
-
22
-
23
-
24
-
25
-
26
-
27
-
28
-
29
-
30
-
31
-
32
-
33
-
34
-
35
-
36
-
37
-
38
-
39
-
40
-
41
-
42
-
43
-
44
-
45
-
46
-
47
-
48
-
49
-
50
-
51
-
52
-
53
-
54
-
55
-
56
-
57
-
58
-
59
-
60
-
61
-
62
-
63
-
64
-
65
-
66
-
67
-
68
-
69
-
70
-
71
-
72
-
73
-
74
-
75
-
76
-
77
-
78
-
79
-
80
-
81
-
82
-
83
-
84
-
85
-
86
-
87
-
88
-
89
-
90
-
91
-
92
-
93
-
94
-
95
-
96
-
97
-
98
-
99
-
100
-
101
-
102
-
103
-
104
-
105
-
106
-
107
-
108
-
109
-
110
-
111
-
112
-
113
-
114
-
115
-
116
-
117
-
118
-
119
-
120
-
121
-
122
-
123
-
124
-
125
-
126
-
127
-
128
-
129
-
130
-
131
-
132
-
133
-
134
-
135
-
136
-
137
-
138
-
139
-
140
-
141
-
142
-
143
-
144
-
145
-
146
-
147
-
148
-
149
-
150
-
151
-
152
-
153
-
154
-
155
-
156
-
157
-
158
-
159
-
 160
160 -
 161
161 -
 162
162 -
 163
163 -
 164
164 -
 165
165 -
 166
166 -
 167
167 -
 168
168 -
 169
169 -
 170
170 -
 171
171 -
 172
172 -
 173
173 -
 174
174 -
 175
175 -
 176
176 -
 177
177 -
 178
178 -
 179
179 -
 180
180 -
181
-
182
-
183
-
184
-
185
-
186
-
187
-
188
-
189
-
190
-
191
-
192
-
193
-
194
-
195
-
196
-
197
-
198
-
199
-
200
-
201
-
202
-
203
-
204
-
205
-
206
-
207
-
208
-
209
-
210
-
211
-
212
-
213
-
214
-
215
-
216
-
217
-
218
-
219
-
220
-
221
-
222
-
223
-
224
-
225
-
226
-
227
-
228
-
229
-
230
-
231
-
232
-
233
-
234
-
235
-
236
-
237
-
238
-
239
-
240
-
241
-
242
-
243
-
244
-
245
-
246
-
247
-
248
-
249
-
250
-
251
-
252
 |
 |

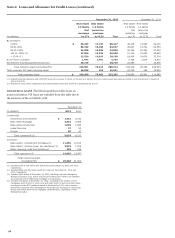
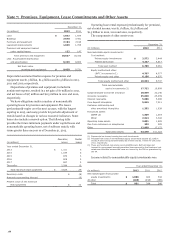
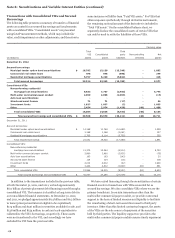
Note 7: Premises, Equipment, Lease Commitments and Other Assets
December 31,
(in millions) 2012 2011
Land $ 1,832 1,825
Buildings 7,670 7,441
Furniture and equipment 7,194 7,195
Leasehold improvements 1,839 1,725
Premises and equipment leased
under capital leases 122 147
Total premises and equipment 18,657 18,333
Less: Accumulated depreciation
and amortization 9,229 8,802
Net book value,
premises and equipment $ 9,428 9,531
Depreciation and amortization expense for premises and
equipment was $1.3 billion, $1.4 billion and $1.5 billion in 2012,
2011 and 2010, respectively.
Dispositions of premises and equipment, included in
noninterest expense, resulted in a net gain of $7 million in 2012,
and net losses of $17 million and $115 million in 2011 and 2010,
respectively.
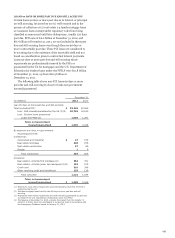
We have obligations under a number of noncancelable
operating leases for premises and equipment. The leases
predominantly expire over the next 15 years, with the longest
expiring in 2105, and many provide for periodic adjustment of
rentals based on changes in various economic indicators. Some
leases also include a renewal option. The following table
provides the future minimum payments under capital leases and
noncancelable operating leases, net of sublease rentals, with
terms greater than one year as of December 31, 2012.
Operating Capital
(in millions) leases leases
Year ended December 31,
2013 $ 1,311 3
2014 1,184 3
2015 970 3
2016 808 3
2017 657 2
Thereafter 2,594 15
Total minimum lease payments $ 7,524 29
Executory costs $ (8)
Amounts representing interest (9)
Present value of net minimum
lease payments $ 12
Operating lease rental expense (predominantly for premises),
net of rental income, was $1.1 billion, $1.2 billion and
$1.3 billion in 2012, 2011 and 2010, respectively.
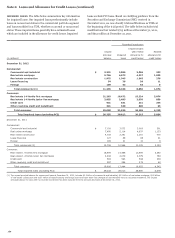
The components of other assets were:
December 31,
(in millions) 2012 2011
Nonmarketable equity investments:
Cost method:
Private equity investments $ 2,572 3,444
Federal bank stock 4,227 4,617
Total cost method 6,799 8,061
Equity method and other:
LIHTC investments (1) 4,767 4,077
Private equity and other 6,156 4,670
Total equity method and other 10,923 8,747
Total nonmarketable
equity investments (2) 17,722 16,808
Corporate/bank-owned life insurance 18,649 20,146
Accounts receivable 25,828 25,939
Interest receivable 5,006 5,296
Core deposit intangibles 5,915 7,311
Customer relationship and
other amortized intangibles 1,352 1,639
Foreclosed assets:
GNMA (3) 1,509 1,319
Other 2,514 3,342
Operating lease assets 2,001 1,825
Due from customers on acceptances 282 225
Other 12,800 17,172
Total other assets $ 93,578 101,022
(1) Represents low income housing tax credit investments.
(2) Proceeds from sales of nonmarketable equity investments totaled $2.3 billion
and $2.4 billion and purchases totaled $2.6 billion and $2.7 billion for 2012 and
2011, respectively.
(3) These are foreclosed real estate securing GNMA loans. Both principal and
interest for government insured/guaranteed loans secured by the foreclosed real
estate are collectible because the loans are insured by the FHA or guaranteed by
the VA.
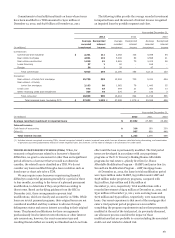
Income related to nonmarketable equity investments was:
Year ended December 31,
(in millions) 2012 2011 2010
Net realized gains from private
equity investments $ 1,086 842 534
All other (185) (298) (188)
Total $ 901 544 346
168