Wells Fargo 2012 Annual Report Download - page 173
Download and view the complete annual report
Please find page 173 of the 2012 Wells Fargo annual report below. You can navigate through the pages in the report by either clicking on the pages listed below, or by using the keyword search tool below to find specific information within the annual report.-
 1
1 -
2
-
3
-
4
-
5
-
6
-
7
-
8
-
9
-
10
-
11
-
12
-
13
-
14
-
15
-
16
-
17
-
18
-
19
-
20
-
21
-
22
-
23
-
24
-
25
-
26
-
27
-
28
-
29
-
30
-
31
-
32
-
33
-
34
-
35
-
36
-
37
-
38
-
39
-
40
-
41
-
42
-
43
-
44
-
45
-
46
-
47
-
48
-
49
-
50
-
51
-
52
-
53
-
54
-
55
-
56
-
57
-
58
-
59
-
60
-
61
-
62
-
63
-
64
-
65
-
66
-
67
-
68
-
69
-
70
-
71
-
72
-
73
-
74
-
75
-
76
-
77
-
78
-
79
-
80
-
81
-
82
-
83
-
84
-
85
-
86
-
87
-
88
-
89
-
90
-
91
-
92
-
93
-
94
-
95
-
96
-
97
-
98
-
99
-
100
-
101
-
102
-
103
-
104
-
105
-
106
-
107
-
108
-
109
-
110
-
111
-
112
-
113
-
114
-
115
-
116
-
117
-
118
-
119
-
120
-
121
-
122
-
123
-
124
-
125
-
126
-
127
-
128
-
129
-
130
-
131
-
132
-
133
-
134
-
135
-
136
-
137
-
138
-
139
-
140
-
141
-
142
-
143
-
144
-
145
-
146
-
147
-
148
-
149
-
150
-
151
-
152
-
153
-
154
-
155
-
156
-
157
-
158
-
159
-
160
-
161
-
162
-
 163
163 -
 164
164 -
 165
165 -
 166
166 -
 167
167 -
 168
168 -
 169
169 -
 170
170 -
 171
171 -
 172
172 -
 173
173 -
 174
174 -
 175
175 -
 176
176 -
 177
177 -
 178
178 -
 179
179 -
 180
180 -
 181
181 -
 182
182 -
 183
183 -
184
-
185
-
186
-
187
-
188
-
189
-
190
-
191
-
192
-
193
-
194
-
195
-
196
-
197
-
198
-
199
-
200
-
201
-
202
-
203
-
204
-
205
-
206
-
207
-
208
-
209
-
210
-
211
-
212
-
213
-
214
-
215
-
216
-
217
-
218
-
219
-
220
-
221
-
222
-
223
-
224
-
225
-
226
-
227
-
228
-
229
-
230
-
231
-
232
-
233
-
234
-
235
-
236
-
237
-
238
-
239
-
240
-
241
-
242
-
243
-
244
-
245
-
246
-
247
-
248
-
249
-
250
-
251
-
252
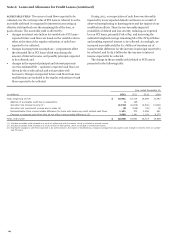
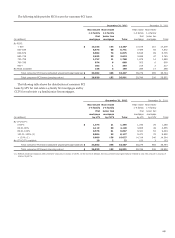
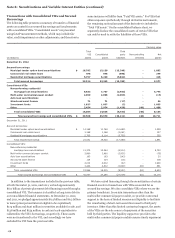
 |
 |

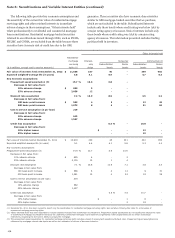
balances presented in the table below where we have determined
that our continuing involvement is not significant due to the
temporary nature and size of our variable interests, because we
were not the transferor or because we were not involved in the
design or operations of the unconsolidated VIEs.
Other
Total Debt and commitments
VIE equity Servicing and Net
(in millions) assets interests (1) assets Derivatives guarantees assets
December 31, 2012
Carrying value - asset (liability)
Residential mortgage loan
securitizations:
Conforming $ 1,268,494 3,620 10,336 - (1,690) 12,266
Other/nonconforming 49,794 2,188 284 - (53) 2,419
Commercial mortgage securitizations 168,126 7,081 466 404 - 7,951
Collateralized debt obligations:
Debt securities 6,940 13 - 471 144 628
Loans (2) 8,155 7,962 - - - 7,962
Asset-based finance structures 10,404 7,155 - (104) - 7,051
Tax credit structures 20,098 5,180 - - (1,657) 3,523
Collateralized loan obligations 6,641 1,439 - 1 - 1,440
Investment funds 4,771 49 - - - 49
Other (3) 10,401 977 28 14 1 1,020
Total $ 1,553,824 35,664 11,114 786 (3,255) 44,309
Maximum exposure to loss
Residential mortgage loan
securitizations:
Conforming $ 3,620 10,336 - 5,061 19,017
Other/nonconforming 2,188 284 - 353 2,825
Commercial mortgage securitizations 7,081 466 446 - 7,993
Collateralized debt obligations:
Debt securities 13 - 471 144 628
Loans (2) 7,962 - - - 7,962
Asset-based finance structures 7,155 - 104 1,967 9,226
Tax credit structures 5,180 - - 247 5,427
Collateralized loan obligations 1,439 - 1 261 1,701
Investment funds 49 - - 27 76
Other (3) 977 28 318 119 1,442
Total $ 35,664 11,114 1,340 8,179 56,297
(continued on following page)
171