Wells Fargo 2012 Annual Report Download - page 197
Download and view the complete annual report
Please find page 197 of the 2012 Wells Fargo annual report below. You can navigate through the pages in the report by either clicking on the pages listed below, or by using the keyword search tool below to find specific information within the annual report.-
 1
1 -
2
-
3
-
4
-
5
-
6
-
7
-
8
-
9
-
10
-
11
-
12
-
13
-
14
-
15
-
16
-
17
-
18
-
19
-
20
-
21
-
22
-
23
-
24
-
25
-
26
-
27
-
28
-
29
-
30
-
31
-
32
-
33
-
34
-
35
-
36
-
37
-
38
-
39
-
40
-
41
-
42
-
43
-
44
-
45
-
46
-
47
-
48
-
49
-
50
-
51
-
52
-
53
-
54
-
55
-
56
-
57
-
58
-
59
-
60
-
61
-
62
-
63
-
64
-
65
-
66
-
67
-
68
-
69
-
70
-
71
-
72
-
73
-
74
-
75
-
76
-
77
-
78
-
79
-
80
-
81
-
82
-
83
-
84
-
85
-
86
-
87
-
88
-
89
-
90
-
91
-
92
-
93
-
94
-
95
-
96
-
97
-
98
-
99
-
100
-
101
-
102
-
103
-
104
-
105
-
106
-
107
-
108
-
109
-
110
-
111
-
112
-
113
-
114
-
115
-
116
-
117
-
118
-
119
-
120
-
121
-
122
-
123
-
124
-
125
-
126
-
127
-
128
-
129
-
130
-
131
-
132
-
133
-
134
-
135
-
136
-
137
-
138
-
139
-
140
-
141
-
142
-
143
-
144
-
145
-
146
-
147
-
148
-
149
-
150
-
151
-
152
-
153
-
154
-
155
-
156
-
157
-
158
-
159
-
160
-
161
-
162
-
163
-
164
-
165
-
166
-
167
-
168
-
169
-
170
-
171
-
172
-
173
-
174
-
175
-
176
-
177
-
178
-
179
-
180
-
181
-
182
-
183
-
184
-
185
-
186
-
 187
187 -
 188
188 -
 189
189 -
 190
190 -
 191
191 -
 192
192 -
 193
193 -
 194
194 -
 195
195 -
 196
196 -
 197
197 -
 198
198 -
 199
199 -
 200
200 -
 201
201 -
 202
202 -
 203
203 -
 204
204 -
 205
205 -
 206
206 -
 207
207 -
208
-
209
-
210
-
211
-
212
-
213
-
214
-
215
-
216
-
217
-
218
-
219
-
220
-
221
-
222
-
223
-
224
-
225
-
226
-
227
-
228
-
229
-
230
-
231
-
232
-
233
-
234
-
235
-
236
-
237
-
238
-
239
-
240
-
241
-
242
-
243
-
244
-
245
-
246
-
247
-
248
-
249
-
250
-
251
-
252
 |
 |

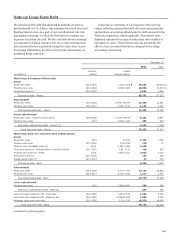
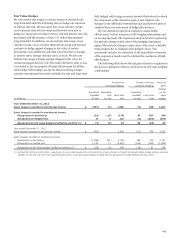
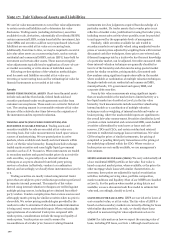
Fair Value Hedges
We use interest rate swaps to convert certain of our fixed-rate
long-term debt and CDs to floating rates to hedge our exposure
to interest rate risk. We also enter into cross-currency swaps,
cross-currency interest rate swaps and forward contracts to
hedge our exposure to foreign currency risk and interest rate risk
associated with the issuance of non-U.S. dollar denominated
long-term debt. In addition, we use interest rate swaps, cross-
currency swaps, cross-currency interest rate swaps and forward
contracts to hedge against changes in fair value of certain
investments in available-for-sale debt securities due to changes
in interest rates, foreign currency rates, or both. We also use
interest rate swaps to hedge against changes in fair value for
certain mortgages held for sale. The entire derivative gain or loss
is included in the assessment of hedge effectiveness for all fair
value hedge relationships, except for those involving foreign-
currency denominated securities available for sale and long-term
debt hedged with foreign currency forward derivatives for which
the component of the derivative gain or loss related to the
changes in the difference between the spot and forward price is
excluded from the assessment of hedge effectiveness.
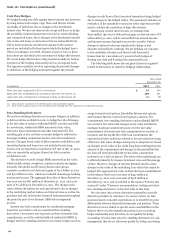
We use statistical regression analysis to assess hedge
effectiveness, both at inception of the hedging relationship and
on an ongoing basis. The regression analysis involves regressing
the periodic change in fair value of the hedging instrument
against the periodic changes in fair value of the asset or liability
being hedged due to changes in the hedged risk(s). The
assessment includes an evaluation of the quantitative measures
of the regression results used to validate the conclusion of high
effectiveness.
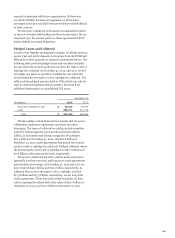
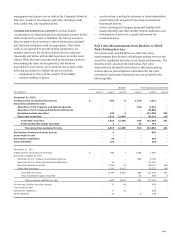
The following table shows the net gains (losses) recognized in
the income statement related to derivatives in fair value hedging
relationships.
Interest rate Foreign exchange Total net
contracts hedging: contracts hedging: gains
(losses)
Securities Mortgages Securities on fair
available held Long-term available Long-term value
(in millions) for sale for sale debt for sale debt hedges
Year ended December 31, 2012
Gains (losses) recorded in net interest income $ (457) (4) 1,685 (5) 248 1,467
Gains (losses) recorded in noninterest income
Recognized on derivatives (22) (15) (179) 39 567 390
Recognized on hedged item 17 6 233 (3) (610) (357)
Recognized on fair value hedges (ineffective portion) (1) $ (5) (9) 54 36 (43) 33
Year ended December 31, 2011
Gains (losses) recorded in net interest income $ (451) - 1,659 (11) 376 1,573
Gains (losses) recorded in noninterest income
Recognized on derivatives (1,298) (21) 2,796 168 512 2,157
Recognized on hedged item 1,232 17 (2,616) (186) (445) (1,998)
Recognized on fair value hedges (ineffective portion) (1) $ (66) (4) 180 (18) 67 159
(1) Included $(9) million and $53 million, respectively, for year ended December 31, 2012 and 2011, of gains (losses) on forward derivatives hedging foreign currency securities
available for sale and long-term debt, representing the portion of derivative gains (losses) excluded from the assessment of hedge effectiveness (time value).
195