Wells Fargo 2012 Annual Report Download - page 72
Download and view the complete annual report
Please find page 72 of the 2012 Wells Fargo annual report below. You can navigate through the pages in the report by either clicking on the pages listed below, or by using the keyword search tool below to find specific information within the annual report.-
 1
1 -
2
-
3
-
4
-
5
-
6
-
7
-
8
-
9
-
10
-
11
-
12
-
13
-
14
-
15
-
16
-
17
-
18
-
19
-
20
-
21
-
22
-
23
-
24
-
25
-
26
-
27
-
28
-
29
-
30
-
31
-
32
-
33
-
34
-
35
-
36
-
37
-
38
-
39
-
40
-
41
-
42
-
43
-
44
-
45
-
46
-
47
-
48
-
49
-
50
-
51
-
52
-
53
-
54
-
55
-
56
-
57
-
58
-
59
-
60
-
61
-
 62
62 -
 63
63 -
 64
64 -
 65
65 -
 66
66 -
 67
67 -
 68
68 -
 69
69 -
 70
70 -
 71
71 -
 72
72 -
 73
73 -
 74
74 -
 75
75 -
 76
76 -
 77
77 -
 78
78 -
 79
79 -
 80
80 -
 81
81 -
 82
82 -
83
-
84
-
85
-
86
-
87
-
88
-
89
-
90
-
91
-
92
-
93
-
94
-
95
-
96
-
97
-
98
-
99
-
100
-
101
-
102
-
103
-
104
-
105
-
106
-
107
-
108
-
109
-
110
-
111
-
112
-
113
-
114
-
115
-
116
-
117
-
118
-
119
-
120
-
121
-
122
-
123
-
124
-
125
-
126
-
127
-
128
-
129
-
130
-
131
-
132
-
133
-
134
-
135
-
136
-
137
-
138
-
139
-
140
-
141
-
142
-
143
-
144
-
145
-
146
-
147
-
148
-
149
-
150
-
151
-
152
-
153
-
154
-
155
-
156
-
157
-
158
-
159
-
160
-
161
-
162
-
163
-
164
-
165
-
166
-
167
-
168
-
169
-
170
-
171
-
172
-
173
-
174
-
175
-
176
-
177
-
178
-
179
-
180
-
181
-
182
-
183
-
184
-
185
-
186
-
187
-
188
-
189
-
190
-
191
-
192
-
193
-
194
-
195
-
196
-
197
-
198
-
199
-
200
-
201
-
202
-
203
-
204
-
205
-
206
-
207
-
208
-
209
-
210
-
211
-
212
-
213
-
214
-
215
-
216
-
217
-
218
-
219
-
220
-
221
-
222
-
223
-
224
-
225
-
226
-
227
-
228
-
229
-
230
-
231
-
232
-
233
-
234
-
235
-
236
-
237
-
238
-
239
-
240
-
241
-
242
-
243
-
244
-
245
-
246
-
247
-
248
-
249
-
250
-
251
-
252
 |
 |

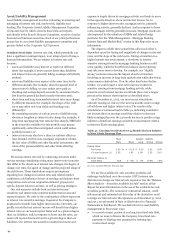
Risk Management – Credit Risk Management (continued)
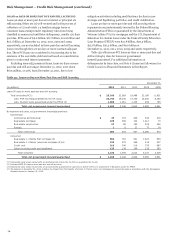
LOANS 90 DAYS OR MORE PAST DUE AND STILL ACCRUING
Loans 90 days or more past due as to interest or principal are
still accruing if they are (1) well-secured and in the process of
collection or (2) real estate 1-4 family mortgage loans or
consumer loans exempt under regulatory rules from being
classified as nonaccrual until later delinquency, usually 120 days
past due. PCI loans of $6.0 billion, $8.7 billion, $11.6 billion and
$16.1 billion, at December 31, 2012, 2011, 2010 and 2009,
respectively, are not included in these past due and still accruing
loans even though they are 90 days or more contractually past
due. These PCI loans are considered to be accruing due to the
existence of the accretable yield and not based on consideration
given to contractual interest payments.
Excluding insured/guaranteed loans, loans 90 days or more
past due and still accruing at December 31, 2012, were down
$613 million, or 30%, from December 31, 2011, due to loss
mitigation activities including modifications, decline in non-
strategic and liquidating portfolios, and credit stabilization.
Loans 90 days or more past due and still accruing whose
repayments are predominantly insured by the Federal Housing
Administration (FHA) or guaranteed by the Department of
Veterans Affairs (VA) for mortgages and the U.S. Department of
Education for student loans under the Federal Family Education
Loan Program (FFELP) were $21.8 billion, $20.5 billion,
$15.8 billion, $16.3 billion, and $9.0 billion at
December 31, 2012, 2011, 2010, 2009 and 2008, respectively.
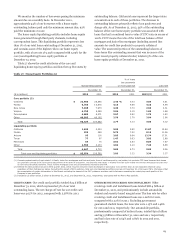
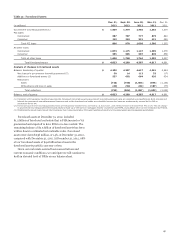
Table 35 reflects non-PCI loans 90 days or more past due and
still accruing by class for loans not government
insured/guaranteed. For additional information on
delinquencies by loan class, see Note 6 (Loans and Allowance for
Credit Losses) to Financial Statements in this Report.
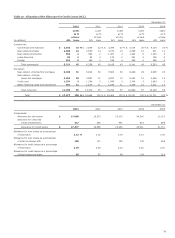
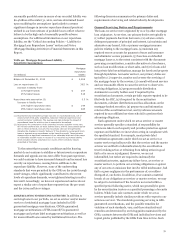
Table 35: Loans 90 Days or More Past Due and Still Accruing
December 31,
(in millions) 2012 2011 2010 2009 2008
Loans 90 days or more past due and still accruing:
Total (excluding PCI): $ 23,245 22,569 18,488 22,188 11,831
Less: FHA insured/guaranteed by the VA (1)(2) 20,745 19,240 14,733 15,336 8,185
Less: Student loans guaranteed under the FFELP (3) 1,065 1,281 1,106 994 765
Total, not government insured/guaranteed $ 1,435 2,048 2,649 5,858 2,881
By segment and class, not government insured/guaranteed:
Commercial:
Commercial and industrial $ 47 153 308 590 218
Real estate mortgage 228 256 104 1,014 70
Real estate construction 27 89 193 909 250
Foreign 1 6 22 73 34
Total commercial 303 504 627 2,586 572
Consumer:
Real estate 1-4 family first mortgage (2) 564 781 941 1,623 883
Real estate 1-4 family junior lien mortgage (2)(4) 133 279 366 515 457
Credit card 310 346 516 795 687
Other revolving credit and installment 125 138 199 339 282
Total consumer 1,132 1,544 2,022 3,272 2,309
Total, not government insured/guaranteed $ 1,435 2,048 2,649 5,858 2,881
(1) Represents loans whose repayments are predominantly insured by the FHA or guaranteed by the VA.
(2) Includes MHFS 90 days or more past due and still accruing.
(3) Represents loans whose repayments are predominantly guaranteed by agencies on behalf of the U.S. Department of Education under the FFELP.
(4) The balance at December 31, 2012, includes the impact from the transfer of certain 1-4 family junior lien mortgages to nonaccrual loans in accordance with the Interagency
Guidance issued on January 31, 2012.
70