Wells Fargo 2012 Annual Report Download - page 68
Download and view the complete annual report
Please find page 68 of the 2012 Wells Fargo annual report below. You can navigate through the pages in the report by either clicking on the pages listed below, or by using the keyword search tool below to find specific information within the annual report.-
 1
1 -
2
-
3
-
4
-
5
-
6
-
7
-
8
-
9
-
10
-
11
-
12
-
13
-
14
-
15
-
16
-
17
-
18
-
19
-
20
-
21
-
22
-
23
-
24
-
25
-
26
-
27
-
28
-
29
-
30
-
31
-
32
-
33
-
34
-
35
-
36
-
37
-
38
-
39
-
40
-
41
-
42
-
43
-
44
-
45
-
46
-
47
-
48
-
49
-
50
-
51
-
52
-
53
-
54
-
55
-
56
-
57
-
 58
58 -
 59
59 -
 60
60 -
 61
61 -
 62
62 -
 63
63 -
 64
64 -
 65
65 -
 66
66 -
 67
67 -
 68
68 -
 69
69 -
 70
70 -
 71
71 -
 72
72 -
 73
73 -
 74
74 -
 75
75 -
 76
76 -
 77
77 -
 78
78 -
79
-
80
-
81
-
82
-
83
-
84
-
85
-
86
-
87
-
88
-
89
-
90
-
91
-
92
-
93
-
94
-
95
-
96
-
97
-
98
-
99
-
100
-
101
-
102
-
103
-
104
-
105
-
106
-
107
-
108
-
109
-
110
-
111
-
112
-
113
-
114
-
115
-
116
-
117
-
118
-
119
-
120
-
121
-
122
-
123
-
124
-
125
-
126
-
127
-
128
-
129
-
130
-
131
-
132
-
133
-
134
-
135
-
136
-
137
-
138
-
139
-
140
-
141
-
142
-
143
-
144
-
145
-
146
-
147
-
148
-
149
-
150
-
151
-
152
-
153
-
154
-
155
-
156
-
157
-
158
-
159
-
160
-
161
-
162
-
163
-
164
-
165
-
166
-
167
-
168
-
169
-
170
-
171
-
172
-
173
-
174
-
175
-
176
-
177
-
178
-
179
-
180
-
181
-
182
-
183
-
184
-
185
-
186
-
187
-
188
-
189
-
190
-
191
-
192
-
193
-
194
-
195
-
196
-
197
-
198
-
199
-
200
-
201
-
202
-
203
-
204
-
205
-
206
-
207
-
208
-
209
-
210
-
211
-
212
-
213
-
214
-
215
-
216
-
217
-
218
-
219
-
220
-
221
-
222
-
223
-
224
-
225
-
226
-
227
-
228
-
229
-
230
-
231
-
232
-
233
-
234
-
235
-
236
-
237
-
238
-
239
-
240
-
241
-
242
-
243
-
244
-
245
-
246
-
247
-
248
-
249
-
250
-
251
-
252
 |
 |

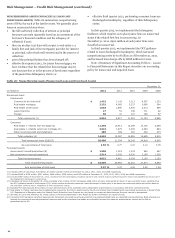
Risk Management – Credit Risk Management (continued)
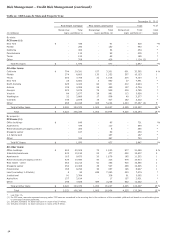
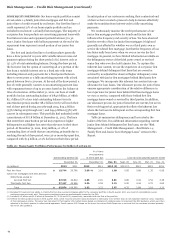
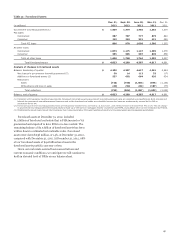
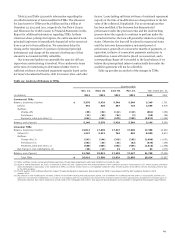
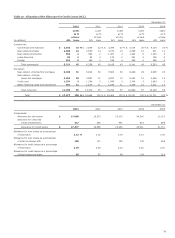
Table 30: Analysis of Changes in Nonaccrual Loans
Quarter ended
Dec. 31, Sept. 30, June 30, Mar. 31, Year ended Dec. 31,
(in millions) 2012 2012 2012 2012 2012 2011
Commercial nonaccrual loans
Balance, beginning of period $ 6,371 6,924 7,599 8,217 8,217 11,351
Inflows 746 976 952 1,138 3,812 5,980
Outflows:
Returned to accruing (135) (90) (242) (188) (655) (1,457)
Foreclosures (107) (151) (92) (119) (469) (683)
Charge-offs (322) (364) (402) (347) (1,435) (1,700)
Payments, sales and other (1) (729) (924) (891) (1,102) (3,646) (5,274)
Total outflows (1,293) (1,529) (1,627) (1,756) (6,205) (9,114)
Balance, end of period 5,824 6,371 6,924 7,599 5,824 8,217
Consumer nonaccrual loans
Balance, beginning of period 14,673 13,654 14,427 13,087 13,087 14,891
Inflows (2) 2,943 4,111 2,750 4,765 14,569 14,407
Outflows:
Returned to accruing (893) (1,039) (1,344) (943) (4,219) (5,920)
Foreclosures (151) (182) (186) (226) (745) (985)
Charge-offs (1,053) (987) (1,137) (1,364) (4,541) (5,828)
Payments, sales and other (1) (857) (884) (856) (892) (3,489) (3,478)
Total outflows (2,954) (3,092) (3,523) (3,425) (12,994) (16,211)
Balance, end of period 14,662 14,673 13,654 14,427 14,662 13,087
Total nonaccrual loans $ 20,486 21,044 20,578 22,026 20,486 21,304
(1) Other outflows include the effects of VIE deconsolidations and adjustments for loans carried at fair value.
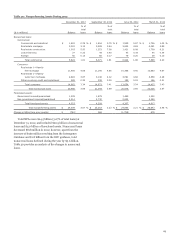
(2) Quarter ended September 30, 2012, includes $1.4 billion of performing loans moved to nonaccrual status as a result of OCC guidance issued in third quarter 2012, which
requires consumer loans discharged in bankruptcy to be placed on nonaccrual status and written down to net realizable collateral value, regardless of their delinquency
status. Quarter ended March 31, 2012, includes $1.7 billion moved to nonaccrual status as a result of implementing Interagency Guidance issued January 31, 2012.
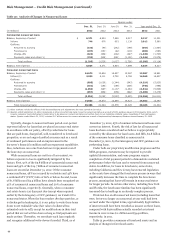
Typically, changes to nonaccrual loans period-over-period
represent inflows for loans that are placed on nonaccrual status
in accordance with our policy, offset by reductions for loans
that are paid down, charged off, sold, transferred to foreclosed
properties, or are no longer classified as nonaccrual as a result
of continued performance and an improvement in the
borrower’s financial condition and loan repayment capabilities.
Also, reductions can come from borrower repayments even if
the loan stays on nonaccrual.
While nonaccrual loans are not free of loss content, we
believe exposure to loss is significantly mitigated by five
factors. First, 97% of the $5.8 billion of commercial nonaccrual
loans and 99% of the $14.7 billion of consumer nonaccrual
loans are secured at December 31, 2012. Of the consumer
nonaccrual loans, 98% are secured by real estate and 45% have
a combined LTV (CLTV) ratio of 80% or below. Second, losses
of $1.8 billion and $4.9 billion have already been recognized on
41% of commercial nonaccrual loans and 50% of consumer
nonaccrual loans, respectively. Generally, when a consumer
real estate loan is 120 days past due (except when required
earlier by the Interagency or OCC guidance), we transfer it to
nonaccrual status. When the loan reaches 180 days past due, or
is discharged in bankruptcy, it is our policy to write these loans
down to net realizable value (fair value of collateral less
estimated costs to sell), except for modifications in their trial
period that are not written down as long as trial payments are
made on time. Thereafter, we reevaluate each loan regularly
and recognize additional write-downs if needed. Third, as of
December 31, 2012, 63% of commercial nonaccrual loans were
current on interest. Fourth, the risk of loss for all nonaccrual
loans has been considered and we believe is appropriately
covered by the allowance for loan losses. And fifth, $2.8 billion
of the consumer loans classified as nonaccrual at
December 31, 2012, by the Interagency and OCC guidance are
performing loans.
Under both our proprietary modification programs and the
MHA programs, customers may be required to provide
updated documentation, and some programs require
completion of trial payment periods to demonstrate sustained
performance before the loan can be removed from nonaccrual
status. In addition, for loans in foreclosure, some states,
including California and New Jersey, have enacted legislation
or the courts have changed the foreclosure process in ways that
significantly increases the time to complete the foreclosure
process, meaning that loans will remain in nonaccrual status
for longer periods. In certain other states, including New York
and Florida, the foreclosure timeline has been significantly
increased due to backlogs in an already complex process.
If interest due on all nonaccrual loans (including loans that
were, but are no longer on nonaccrual at year end) had been
accrued under the original terms, approximately $938 million
of interest would have been recorded as income on these loans,
compared with $406 million actually recorded as interest
income in 2012 versus $1.1 billion and $344 million,
respectively, in 2011.
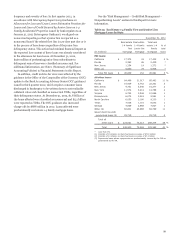
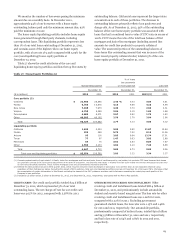
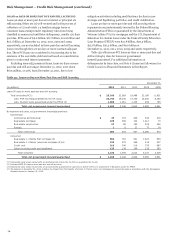
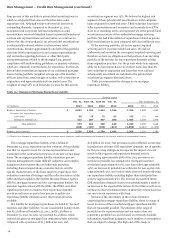
Table 31 provides a summary of foreclosed assets and an
analysis of changes in foreclosed assets.
66