Wells Fargo 2012 Annual Report Download - page 168
Download and view the complete annual report
Please find page 168 of the 2012 Wells Fargo annual report below. You can navigate through the pages in the report by either clicking on the pages listed below, or by using the keyword search tool below to find specific information within the annual report.-
 1
1 -
2
-
3
-
4
-
5
-
6
-
7
-
8
-
9
-
10
-
11
-
12
-
13
-
14
-
15
-
16
-
17
-
18
-
19
-
20
-
21
-
22
-
23
-
24
-
25
-
26
-
27
-
28
-
29
-
30
-
31
-
32
-
33
-
34
-
35
-
36
-
37
-
38
-
39
-
40
-
41
-
42
-
43
-
44
-
45
-
46
-
47
-
48
-
49
-
50
-
51
-
52
-
53
-
54
-
55
-
56
-
57
-
58
-
59
-
60
-
61
-
62
-
63
-
64
-
65
-
66
-
67
-
68
-
69
-
70
-
71
-
72
-
73
-
74
-
75
-
76
-
77
-
78
-
79
-
80
-
81
-
82
-
83
-
84
-
85
-
86
-
87
-
88
-
89
-
90
-
91
-
92
-
93
-
94
-
95
-
96
-
97
-
98
-
99
-
100
-
101
-
102
-
103
-
104
-
105
-
106
-
107
-
108
-
109
-
110
-
111
-
112
-
113
-
114
-
115
-
116
-
117
-
118
-
119
-
120
-
121
-
122
-
123
-
124
-
125
-
126
-
127
-
128
-
129
-
130
-
131
-
132
-
133
-
134
-
135
-
136
-
137
-
138
-
139
-
140
-
141
-
142
-
143
-
144
-
145
-
146
-
147
-
148
-
149
-
150
-
151
-
152
-
153
-
154
-
155
-
156
-
157
-
 158
158 -
 159
159 -
 160
160 -
 161
161 -
 162
162 -
 163
163 -
 164
164 -
 165
165 -
 166
166 -
 167
167 -
 168
168 -
 169
169 -
 170
170 -
 171
171 -
 172
172 -
 173
173 -
 174
174 -
 175
175 -
 176
176 -
 177
177 -
 178
178 -
179
-
180
-
181
-
182
-
183
-
184
-
185
-
186
-
187
-
188
-
189
-
190
-
191
-
192
-
193
-
194
-
195
-
196
-
197
-
198
-
199
-
200
-
201
-
202
-
203
-
204
-
205
-
206
-
207
-
208
-
209
-
210
-
211
-
212
-
213
-
214
-
215
-
216
-
217
-
218
-
219
-
220
-
221
-
222
-
223
-
224
-
225
-
226
-
227
-
228
-
229
-
230
-
231
-
232
-
233
-
234
-
235
-
236
-
237
-
238
-
239
-
240
-
241
-
242
-
243
-
244
-
245
-
246
-
247
-
248
-
249
-
250
-
251
-
252
 |
 |

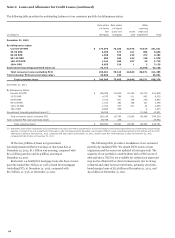
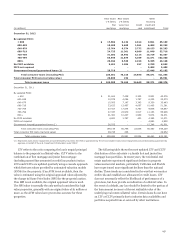
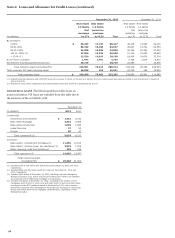
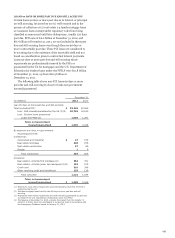
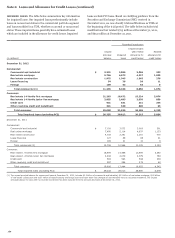
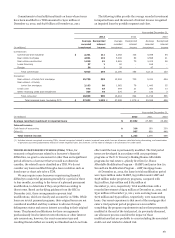
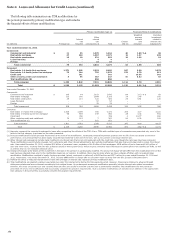
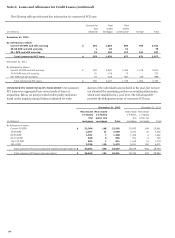
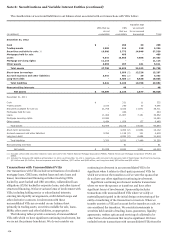
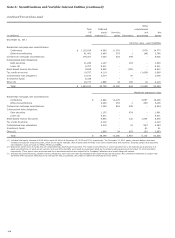
Note 6: Loans and Allowance for Credit Losses (continued)
The following table provides past due information for commercial PCI loans.
Commercial Real Real
and estate estate
(in millions) industrial mortgage construction Foreign Total
December 31, 2012
By delinquency status:
Current-29 DPD and still accruing $ 235 1,804 699 704 3,442
30-89 DPD and still accruing 1 26 51 - 78
90+ DPD and still accruing 23 140 127 167 457
Total commercial PCI loans $ 259 1,970 877 871 3,977
December 31, 2011
By delinquency status:
Current-29 DPD and still accruing $ 359 2,867 1,206 1,178 5,610
30-89 DPD and still accruing 22 178 72 - 272
90+ DPD and still accruing 18 225 467 175 885
Total commercial PCI loans $ 399 3,270 1,745 1,353 6,767
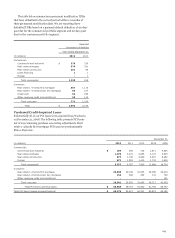
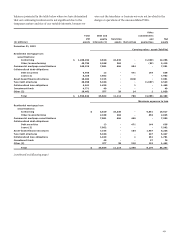
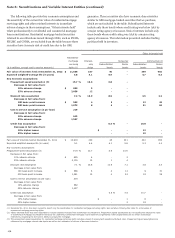
CONSUMER PCI CREDIT QUALITY INDICATORS Our consumer
PCI loans were aggregated into several pools of loans at
acquisition. Below, we have provided credit quality indicators
based on the unpaid principal balance (adjusted for write-
downs) of the individual loans included in the pool, but we have
not allocated the remaining purchase accounting adjustments,
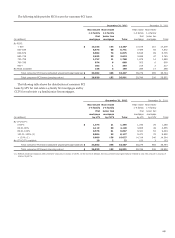
which were established at a pool level. The following table
provides the delinquency status of consumer PCI loans.
December 31, 2012 December 31, 2011
Real estate Real estate Real estate Real estate
1-4 family 1-4 family 1-4 family 1-4 family
firs
t
junior lien first junior lien
(in millions) mortgage mortgage Total mortgage mortgage Total
By delinquency status:
Current-29 DPD $ 22,304 198 22,502 25,693 268 25,961
30-59 DPD 2,587 11 2,598 3,272 20 3,292
60-89 DPD 1,361 7 1,368 1,433 9 1,442
90-119 DPD 650 6 656 791 8 799
120-179 DPD 804 7 811 1,169 10 1,179
180+ DPD 5,356 116 5,472 5,921 150 6,071
Total consumer PCI loans (adjusted unpaid principal balance) $ 33,062 345 33,407 38,279 465 38,744
Total consumer PCI loans (carrying value) $ 26,839 152 26,991 29,746 206 29,952
166