Wells Fargo 2012 Annual Report Download - page 235
Download and view the complete annual report
Please find page 235 of the 2012 Wells Fargo annual report below. You can navigate through the pages in the report by either clicking on the pages listed below, or by using the keyword search tool below to find specific information within the annual report.-
 1
1 -
2
-
3
-
4
-
5
-
6
-
7
-
8
-
9
-
10
-
11
-
12
-
13
-
14
-
15
-
16
-
17
-
18
-
19
-
20
-
21
-
22
-
23
-
24
-
25
-
26
-
27
-
28
-
29
-
30
-
31
-
32
-
33
-
34
-
35
-
36
-
37
-
38
-
39
-
40
-
41
-
42
-
43
-
44
-
45
-
46
-
47
-
48
-
49
-
50
-
51
-
52
-
53
-
54
-
55
-
56
-
57
-
58
-
59
-
60
-
61
-
62
-
63
-
64
-
65
-
66
-
67
-
68
-
69
-
70
-
71
-
72
-
73
-
74
-
75
-
76
-
77
-
78
-
79
-
80
-
81
-
82
-
83
-
84
-
85
-
86
-
87
-
88
-
89
-
90
-
91
-
92
-
93
-
94
-
95
-
96
-
97
-
98
-
99
-
100
-
101
-
102
-
103
-
104
-
105
-
106
-
107
-
108
-
109
-
110
-
111
-
112
-
113
-
114
-
115
-
116
-
117
-
118
-
119
-
120
-
121
-
122
-
123
-
124
-
125
-
126
-
127
-
128
-
129
-
130
-
131
-
132
-
133
-
134
-
135
-
136
-
137
-
138
-
139
-
140
-
141
-
142
-
143
-
144
-
145
-
146
-
147
-
148
-
149
-
150
-
151
-
152
-
153
-
154
-
155
-
156
-
157
-
158
-
159
-
160
-
161
-
162
-
163
-
164
-
165
-
166
-
167
-
168
-
169
-
170
-
171
-
172
-
173
-
174
-
175
-
176
-
177
-
178
-
179
-
180
-
181
-
182
-
183
-
184
-
185
-
186
-
187
-
188
-
189
-
190
-
191
-
192
-
193
-
194
-
195
-
196
-
197
-
198
-
199
-
200
-
201
-
202
-
203
-
204
-
205
-
206
-
207
-
208
-
209
-
210
-
211
-
212
-
213
-
214
-
215
-
216
-
217
-
218
-
219
-
220
-
221
-
222
-
223
-
224
-
 225
225 -
 226
226 -
 227
227 -
 228
228 -
 229
229 -
 230
230 -
 231
231 -
 232
232 -
 233
233 -
 234
234 -
 235
235 -
 236
236 -
 237
237 -
 238
238 -
 239
239 -
 240
240 -
 241
241 -
 242
242 -
 243
243 -
 244
244 -
 245
245 -
246
-
247
-
248
-
249
-
250
-
251
-
252
 |
 |

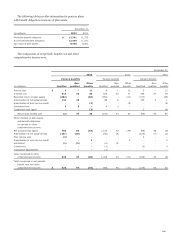
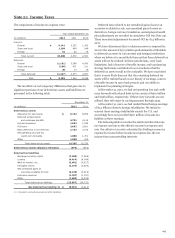
Note 21: Income Taxes
The components of income tax expense were:
Year ended December 31,
(in millions) 2012 2011 2010
Current:
Federal $ 9,141 3,352 1,425
State and local 1,198 468 548
Foreign 61 52 78
Total current 10,400 3,872 2,051
Deferred:
Federal (1,151) 3,088 4,060
State and local (166) 471 211
Foreign 20 14 16
Total deferred (1,297) 3,573 4,287
Total $ 9,103 7,445 6,338
The tax effects of our temporary differences that gave rise to
significant portions of our deferred tax assets and liabilities are
presented in the following table.
December 31,
(in millions) 2012 2011
Deferred tax assets
Allowance for loan losses $ 6,192 6,955
Deferred compensation
and employee benefits 4,701 4,115
Accrued expenses 1,692 1,598
PCI loans 2,692 3,851
Basis difference in investments 1,182 2,104
Net operating loss and tax
credit carry forwards 1,058 1,701
Other 1,868 402
Total deferred tax assets 19,385 20,726
Deferred tax assets valuation allowance (579) (918)
Deferred tax liabilities
Mortgage servicing rights (7,360) (7,388)
Leasing (4,414) (4,344)
Mark to market, net (2,401) (4,027)
Intangible assets (2,157) (2,608)
Net unrealized gains on
securities available for sale (4,135) (2,619)
Insurance reserves (1,707) (1,197)
Other (1,683) (2,539)
Total deferred tax liabilities (23,857) (24,722)
Net deferred tax liability (1) $ (5,051) (4,914)
(
1
)
Included in accrued ex
p
enses and other liabilities.
Deferred taxes related to net unrealized gains (losses) on
securities available for sale, net unrealized gains (losses) on
derivatives, foreign currency translation, and employee benefit
plan adjustments are recorded in cumulative OCI (see Note 23).
These associated adjustments decreased OCI by $1.4 billion in
2012.
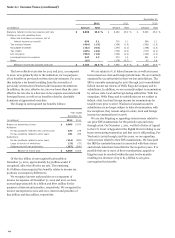
We have determined that a valuation reserve is required for
2012 in the amount of $579 million predominantly attributable
to deferred tax assets in various state and foreign jurisdictions
where we believe it is more likely than not that these deferred tax
assets will not be realized. In these jurisdictions, carry back
limitations, lack of sources of taxable income, and tax planning
strategy limitations contributed to our conclusion that the
deferred tax assets would not be realizable. We have concluded
that it is more likely than not that the remaining deferred tax
assets will be realized based on our history of earnings, sources
of taxable income in carry back periods, and our ability to
implement tax planning strategies.
At December 31, 2012, we had net operating loss and credit
carry forwards with related deferred tax assets of $900 million
and $158 million, respectively. If these carry forwards are not
utilized, they will expire in varying amounts through 2032.
At December 31, 2012, we had undistributed foreign earnings
of $1.3 billion related to foreign subsidiaries. We intend to
reinvest these earnings indefinitely outside the U.S. and
accordingly have not provided $367 million of income tax
liability on these earnings.
The following table reconciles the statutory federal income
tax expense and rate to the effective income tax expense and
rate. Our effective tax rate is calculated by dividing income tax
expense by income before income tax expense less the net
income from noncontrolling interests.
233