Wells Fargo 2012 Annual Report Download - page 199
Download and view the complete annual report
Please find page 199 of the 2012 Wells Fargo annual report below. You can navigate through the pages in the report by either clicking on the pages listed below, or by using the keyword search tool below to find specific information within the annual report.-
 1
1 -
2
-
3
-
4
-
5
-
6
-
7
-
8
-
9
-
10
-
11
-
12
-
13
-
14
-
15
-
16
-
17
-
18
-
19
-
20
-
21
-
22
-
23
-
24
-
25
-
26
-
27
-
28
-
29
-
30
-
31
-
32
-
33
-
34
-
35
-
36
-
37
-
38
-
39
-
40
-
41
-
42
-
43
-
44
-
45
-
46
-
47
-
48
-
49
-
50
-
51
-
52
-
53
-
54
-
55
-
56
-
57
-
58
-
59
-
60
-
61
-
62
-
63
-
64
-
65
-
66
-
67
-
68
-
69
-
70
-
71
-
72
-
73
-
74
-
75
-
76
-
77
-
78
-
79
-
80
-
81
-
82
-
83
-
84
-
85
-
86
-
87
-
88
-
89
-
90
-
91
-
92
-
93
-
94
-
95
-
96
-
97
-
98
-
99
-
100
-
101
-
102
-
103
-
104
-
105
-
106
-
107
-
108
-
109
-
110
-
111
-
112
-
113
-
114
-
115
-
116
-
117
-
118
-
119
-
120
-
121
-
122
-
123
-
124
-
125
-
126
-
127
-
128
-
129
-
130
-
131
-
132
-
133
-
134
-
135
-
136
-
137
-
138
-
139
-
140
-
141
-
142
-
143
-
144
-
145
-
146
-
147
-
148
-
149
-
150
-
151
-
152
-
153
-
154
-
155
-
156
-
157
-
158
-
159
-
160
-
161
-
162
-
163
-
164
-
165
-
166
-
167
-
168
-
169
-
170
-
171
-
172
-
173
-
174
-
175
-
176
-
177
-
178
-
179
-
180
-
181
-
182
-
183
-
184
-
185
-
186
-
187
-
188
-
 189
189 -
 190
190 -
 191
191 -
 192
192 -
 193
193 -
 194
194 -
 195
195 -
 196
196 -
 197
197 -
 198
198 -
 199
199 -
 200
200 -
 201
201 -
 202
202 -
 203
203 -
 204
204 -
 205
205 -
 206
206 -
 207
207 -
 208
208 -
 209
209 -
210
-
211
-
212
-
213
-
214
-
215
-
216
-
217
-
218
-
219
-
220
-
221
-
222
-
223
-
224
-
225
-
226
-
227
-
228
-
229
-
230
-
231
-
232
-
233
-
234
-
235
-
236
-
237
-
238
-
239
-
240
-
241
-
242
-
243
-
244
-
245
-
246
-
247
-
248
-
249
-
250
-
251
-
252
 |
 |

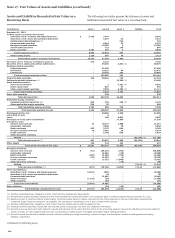
They are carried at fair value with changes in fair value recorded
as other noninterest income.
Free-standing derivatives also include embedded derivatives
that are required to be accounted for separately from their host
contract. We periodically issue hybrid long-term notes and CDs
where the performance of the hybrid instrument notes is linked
to an equity, commodity or currency index, or basket of such
indices. These notes contain explicit terms that affect some or all
of the cash flows or the value of the note in a manner similar to a
derivative instrument and therefore are considered to contain an
“embedded” derivative instrument. The indices on which the
performance of the hybrid instrument is calculated are not
clearly and closely related to the host debt instrument. The
“embedded” derivative is separated from the host contract and
accounted for as a free-standing derivative. Additionally, we may
invest in hybrid instruments that contain embedded derivatives,
such as credit derivatives, that are not clearly and closely related
to the host contract. In such instances, we either elect fair value
option for the hybrid instrument or separate the embedded
derivative from the host contract and account for the host
contract and derivative separately.
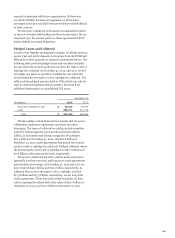
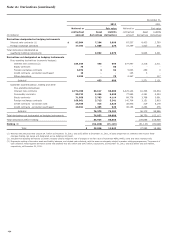
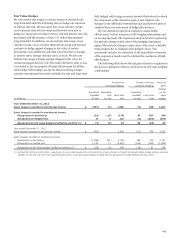
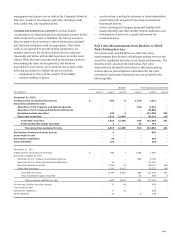
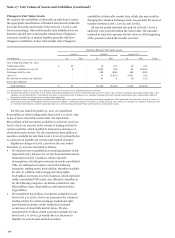
The following table shows the net gains recognized in the
income statement related to derivatives not designated as
hedging instruments.
Year ended
December 31,
(in millions) 2012 2011
Net gains (losses) recognized on free-standing derivatives (economic hedges):
Interest rate contracts
Recognized in noninterest income:
Mortgage banking (1) $ (1,882) 246
Other (2) 2 (157)
Equity contracts (2) 4 (5)
Foreign exchange contracts (2) (53) 70
Credit contracts (2) (15) (18)
Subtotal (1,944) 136
Net gains (losses) recognized on customer accommodation, trading and other free-standing derivatives:
Interest rate contracts
Recognized in noninterest income:
Mortgage banking (3) 7,222 3,594
Other (4) 589 298
Commodity contracts (4) (14) 124
Equity contracts (4) (234) 769
Foreign exchange contracts (4) 501 698
Credit contracts (4) (54) (200)
Other (4) - (5)
Subtotal 8,010 5,278
Net gains recognized related to derivatives not designated as hedging instruments $ 6,066 5,414
(1) Predominantly mortgage banking noninterest income including gains (losses) on the derivatives used as economic hedges of MSRs measured at fair value, interest rate lock
commitments and mortgages held for sale.
(2) Predominantly included in other noninterest income.
(3) Predominantly mortgage banking noninterest income including gains (losses) on interest rate lock commitments.
(4) Predominantly included in net gains from trading activities in noninterest income.
Credit Derivatives
We use credit derivatives primarily to assist customers with their
risk management objectives. We may also use credit derivatives
in structured product transactions or liquidity agreements
written to special purpose vehicles. The maximum exposure of
sold credit derivatives is managed through posted collateral,
purchased credit derivatives and similar products in order to
achieve our desired credit risk profile. This credit risk
management provides an ability to recover a significant portion
of any amounts that would be paid under the sold credit
derivatives. We would be required to perform under the noted
credit derivatives in the event of default by the referenced
obligors. Events of default include events such as bankruptcy,
capital restructuring or lack of principal and/or interest
payment. In certain cases, other triggers may exist, such as the
credit downgrade of the referenced obligors or the inability of
the special purpose vehicle for which we have provided liquidity
to obtain funding.
197