Wells Fargo 2012 Annual Report Download - page 208
Download and view the complete annual report
Please find page 208 of the 2012 Wells Fargo annual report below. You can navigate through the pages in the report by either clicking on the pages listed below, or by using the keyword search tool below to find specific information within the annual report.-
 1
1 -
2
-
3
-
4
-
5
-
6
-
7
-
8
-
9
-
10
-
11
-
12
-
13
-
14
-
15
-
16
-
17
-
18
-
19
-
20
-
21
-
22
-
23
-
24
-
25
-
26
-
27
-
28
-
29
-
30
-
31
-
32
-
33
-
34
-
35
-
36
-
37
-
38
-
39
-
40
-
41
-
42
-
43
-
44
-
45
-
46
-
47
-
48
-
49
-
50
-
51
-
52
-
53
-
54
-
55
-
56
-
57
-
58
-
59
-
60
-
61
-
62
-
63
-
64
-
65
-
66
-
67
-
68
-
69
-
70
-
71
-
72
-
73
-
74
-
75
-
76
-
77
-
78
-
79
-
80
-
81
-
82
-
83
-
84
-
85
-
86
-
87
-
88
-
89
-
90
-
91
-
92
-
93
-
94
-
95
-
96
-
97
-
98
-
99
-
100
-
101
-
102
-
103
-
104
-
105
-
106
-
107
-
108
-
109
-
110
-
111
-
112
-
113
-
114
-
115
-
116
-
117
-
118
-
119
-
120
-
121
-
122
-
123
-
124
-
125
-
126
-
127
-
128
-
129
-
130
-
131
-
132
-
133
-
134
-
135
-
136
-
137
-
138
-
139
-
140
-
141
-
142
-
143
-
144
-
145
-
146
-
147
-
148
-
149
-
150
-
151
-
152
-
153
-
154
-
155
-
156
-
157
-
158
-
159
-
160
-
161
-
162
-
163
-
164
-
165
-
166
-
167
-
168
-
169
-
170
-
171
-
172
-
173
-
174
-
175
-
176
-
177
-
178
-
179
-
180
-
181
-
182
-
183
-
184
-
185
-
186
-
187
-
188
-
189
-
190
-
191
-
192
-
193
-
194
-
195
-
196
-
197
-
 198
198 -
 199
199 -
 200
200 -
 201
201 -
 202
202 -
 203
203 -
 204
204 -
 205
205 -
 206
206 -
 207
207 -
 208
208 -
 209
209 -
 210
210 -
 211
211 -
 212
212 -
 213
213 -
 214
214 -
 215
215 -
 216
216 -
 217
217 -
 218
218 -
219
-
220
-
221
-
222
-
223
-
224
-
225
-
226
-
227
-
228
-
229
-
230
-
231
-
232
-
233
-
234
-
235
-
236
-
237
-
238
-
239
-
240
-
241
-
242
-
243
-
244
-
245
-
246
-
247
-
248
-
249
-
250
-
251
-
252
 |
 |

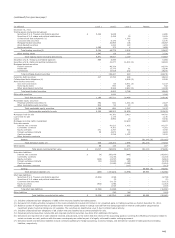
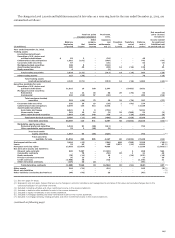
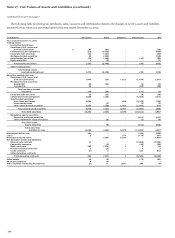
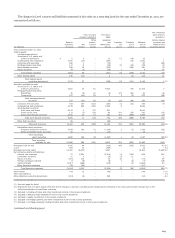
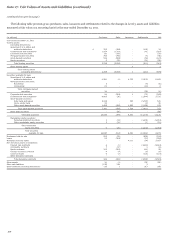
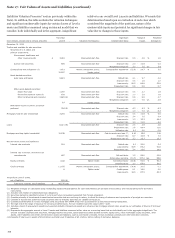
Note 17: Fair Values of Assets and Liabilities (continued)
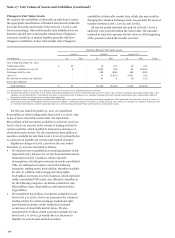
Changes in Fair Value Levels
We monitor the availability of observable market data to assess
the appropriate classification of financial instruments within the
fair value hierarchy and transfer between Level 1, Level 2, and
Level 3 accordingly. Observable market data includes but is not
limited to quoted prices and market transactions. Changes in
economic conditions or market liquidity generally will drive
changes in availability of observable market data. Changes in
availability of observable market data, which also may result in
changing the valuation technique used, are generally the cause of
transfers between Level 1, Level 2, and Level 3.
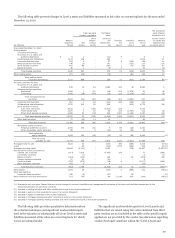
All current period transfers into and out of Level 1, Level 2,
and Level 3 are provided within the below table. The amounts
reported as transfers represent the fair value as of the beginning
of the quarter in which the transfer occurred.
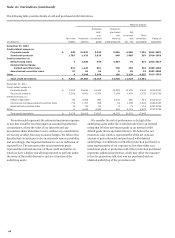
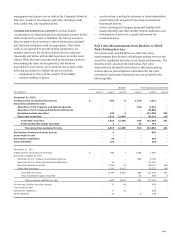
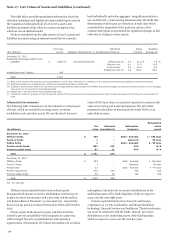
Transfers Between Fair Value Levels
Level 1 Level 2 Level 3 (1)
(in millions) In Out In Out In Out Total
Year ended December 31, 2012
Trading securities $ 23 - 16 (37) 14 (16) -
Securities available for sale (2) 8 - 9,832 (68) 60 (9,832) -
Mortgages held for sale - - 298 (488) 488 (298) -
Loans (3) - - 41 (5,851) 5,851 (41) -
Net derivative assets and liabilities - - 51 8 (8) (51) -
Short sale liabilities - - - - - - -
Total transfers $ 31 - 10,238 (6,436) 6,405 (10,238) -
(1) All transfers in and out of Level 3 are disclosed within the recurring level 3 rollforward table in this Note.
(2) Includes $9.4 billion of securities of U.S. states and political subdivisions that we transferred from Level 3 to Level 2 as a result of increased observable market data in the
valuation of such instruments. This transfer was done in conjunction with a change in our valuation technique from an internal model based upon unobservable inputs to
third party vendor pricing based upon market observable data.
(3) Consists of reverse mortgage loans securitized with GNMA which were accounted for as secured borrowing transactions. We transferred the loans from Level 2 to Level 3 in
third quarter 2012 due to decreased market activity and visibility to significant trades of the same or similar products. As a result, we changed our valuation technique from
an internal model based on market observable data to an internal discounted cash flow model based on unobservable inputs.
For the year ended December 31, 2011, we transferred
$709 million of other trading assets from Level 2 to Level 1 due
to use of more observable market data. We transferred
$801 million of debt securities available for sale from Level 3 to
Level 2 due to an increase in the volume of trading activity for
certain securities, which resulted in increased occurrences of
observable market prices. We also transferred $502 million of
securities available for sale from Level 2 to Level 3 primarily due
to a decrease in liquidity for certain asset-backed securities.
Significant changes to Level 3 assets for the year ended
December 31, 2010 are described as follows:
x We adopted new consolidation accounting guidance which
impacted Level 3 balances for certain financial instruments.
Reductions in Level 3 balances, which represent
derecognition of existing investments in newly consolidated
VIEs, are reflected as transfers out for the following
categories: trading assets, $276 million; securities available
for sale, $1.9 billion; and mortgage servicing rights,
$118 million. Increases in Level 3 balances, which represent
newly consolidated VIE assets, are reflected as transfers in
for the following categories: securities available for sale,
$829 million; loans, $366 million; and long-term debt,
$359 million.
x We transferred $4.9 billion of securities available for sale
from Level 3 to Level 2 due to an increase in the volume of
trading activity for certain mortgage-backed and other
asset-backed securities, which resulted in increased
occurrences of observable market prices. We also
transferred $1.7 billion of debt securities available for sale
from Level 2 to Level 3, primarily due to a decrease in
liquidity for certain asset-backed securities.
206