Wells Fargo 2012 Annual Report Download - page 247
Download and view the complete annual report
Please find page 247 of the 2012 Wells Fargo annual report below. You can navigate through the pages in the report by either clicking on the pages listed below, or by using the keyword search tool below to find specific information within the annual report.-
 1
1 -
2
-
3
-
4
-
5
-
6
-
7
-
8
-
9
-
10
-
11
-
12
-
13
-
14
-
15
-
16
-
17
-
18
-
19
-
20
-
21
-
22
-
23
-
24
-
25
-
26
-
27
-
28
-
29
-
30
-
31
-
32
-
33
-
34
-
35
-
36
-
37
-
38
-
39
-
40
-
41
-
42
-
43
-
44
-
45
-
46
-
47
-
48
-
49
-
50
-
51
-
52
-
53
-
54
-
55
-
56
-
57
-
58
-
59
-
60
-
61
-
62
-
63
-
64
-
65
-
66
-
67
-
68
-
69
-
70
-
71
-
72
-
73
-
74
-
75
-
76
-
77
-
78
-
79
-
80
-
81
-
82
-
83
-
84
-
85
-
86
-
87
-
88
-
89
-
90
-
91
-
92
-
93
-
94
-
95
-
96
-
97
-
98
-
99
-
100
-
101
-
102
-
103
-
104
-
105
-
106
-
107
-
108
-
109
-
110
-
111
-
112
-
113
-
114
-
115
-
116
-
117
-
118
-
119
-
120
-
121
-
122
-
123
-
124
-
125
-
126
-
127
-
128
-
129
-
130
-
131
-
132
-
133
-
134
-
135
-
136
-
137
-
138
-
139
-
140
-
141
-
142
-
143
-
144
-
145
-
146
-
147
-
148
-
149
-
150
-
151
-
152
-
153
-
154
-
155
-
156
-
157
-
158
-
159
-
160
-
161
-
162
-
163
-
164
-
165
-
166
-
167
-
168
-
169
-
170
-
171
-
172
-
173
-
174
-
175
-
176
-
177
-
178
-
179
-
180
-
181
-
182
-
183
-
184
-
185
-
186
-
187
-
188
-
189
-
190
-
191
-
192
-
193
-
194
-
195
-
196
-
197
-
198
-
199
-
200
-
201
-
202
-
203
-
204
-
205
-
206
-
207
-
208
-
209
-
210
-
211
-
212
-
213
-
214
-
215
-
216
-
217
-
218
-
219
-
220
-
221
-
222
-
223
-
224
-
225
-
226
-
227
-
228
-
229
-
230
-
231
-
232
-
233
-
234
-
235
-
236
-
 237
237 -
 238
238 -
 239
239 -
 240
240 -
 241
241 -
 242
242 -
 243
243 -
 244
244 -
 245
245 -
 246
246 -
 247
247 -
 248
248 -
 249
249 -
 250
250 -
 251
251 -
 252
252
 |
 |

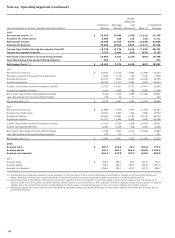
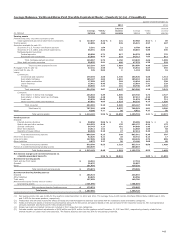
Average Balances, Yields and Rates Paid (Taxable-Equivalent Basis) - Quarterly (1) (2) - (Unaudited)
Quarter ended December 31,
2012 2011
Interest Interest
Average Yields/ income/ Average Yields/ income/
(in millions) balance rates expense balance rates expense
Earning assets
Federal funds sold, securities purchased under
resale agreements and other short-term investments $ 117,047 0.41 % $ 121 67,968 0.52 % $ 89
Trading assets 42,005 3.28 345 45,521 3.57 407
Securities available for sale (3):
Securities of U.S. Treasury and federal agencies 5,281 1.64 22 8,708 0.99 22
Securities of U.S. states and political subdivisions 36,391 4.64 422 28,015 4.80 336
Mortgage-backed securities:
Federal agencies 90,898 2.71 617 84,332 3.68 776
Residential and commercial 32,669 6.53 533 34,717 7.05 612
Total mortgage-backed securities 123,567 3.72 1,150 119,049 4.66 1,388
Other debt and equity securities 50,025 3.91 490 47,278 4.38 518
Total securities available for sale 215,264 3.87 2,084 203,050 4.46 2,264
Mortgages held for sale (4) 47,241 3.50 413 44,842 4.07 456
Loans held for sale (4) 135 9.03 3 1,118 5.84 16
Loans:
Commercial:
Commercial and industrial 179,493 3.85 1,736 166,920 4.08 1,713
Real estate mortgage 105,107 4.02 1,061 105,219 4.26 1,130
Real estate construction 17,502 4.97 218 19,624 4.61 228
Lease financing 12,461 6.43 201 12,893 7.41 239
Foreign 39,665 2.32 231 38,740 2.39 233
Total commercial 354,228 3.87 3,447 343,396 4.10 3,543
Consumer:
Real estate 1-4 family first mortgage 244,634 4.39 2,686 229,746 4.74 2,727
Real estate 1-4 family junior lien mortgage 76,908 4.28 826 87,212 4.34 953
Credit card 23,839 12.43 745 21,933 12.96 711
Other revolving credit and installment 87,601 6.05 1,333 86,276 6.23 1,356
Total consumer 432,982 5.15 5,590 425,167 5.39 5,747
Total loans (4) 787,210 4.58 9,037 768,563 4.81 9,290
Other 4,280 5.21 56 4,671 4.32 50
Total earning assets $ 1,213,182 3.96 % $ 12,059 1,135,733 4.41 % $ 12,572
Funding sources
Deposits:
Interest-bearing checking $ 30,858 0.06 % $ 5 35,285 0.06 % $ 6
Market rate and other savings 518,593 0.10 135 485,127 0.14 175
Savings certificates 56,743 1.27 181 64,868 1.43 233
Other time deposits 13,612 1.51 51 12,868 1.85 60
Deposits in foreign offices 69,398 0.15 27 67,213 0.20 33
Total interest-bearing deposits 689,204 0.23 399 665,361 0.30 507
Short-term borrowings 52,820 0.21 28 48,742 0.14 17
Long-term debt 127,505 2.30 735 129,445 2.73 885
Other liabilities 9,975 2.27 56 12,166 2.60 80
Total interest-bearing liabilities 879,504 0.55 1,218 855,714 0.69 1,489
Portion of noninterest-bearing funding sources 333,678 - - 280,019 - -
Total funding sources $ 1,213,182 0.40 1,218 1,135,733 0.52 1,489
Net interest margin and net interest income on
a taxable-equivalent basis (5) 3.56 % $ 10,841 3.89 % $ 11,083
Noninterest-earning assets
Cash and due from banks $ 16,361 17,718
Goodwill 25,637 25,057
Other 131,876 128,220
Total noninterest-earning assets $ 173,874 170,995
Noninterest-bearing funding sources
Deposits $ 286,924 246,692
Other liabilities 63,025 63,556
Total equity 157,603 140,766
Noninterest-bearing funding sources used to
fund earning assets (333,678) (280,019)
Net noninterest-bearing funding sources $ 173,874 170,995
Total assets $ 1,387,056 1,306,728
(1) Our average prime rate was 3.25% for the quarters ended December 31, 2012 and 2011. The average three-month London Interbank Offered Rate (LIBOR) was 0.32%
and 0.48% for the same quarters, respectively.
(2) Yields/rates and amounts include the effects of hedge and risk management activities associated with the respective asset and liability categories.
(3) Yields and rates are based on interest income/expense amounts for the period, annualized based on the accrual basis for the respective accounts. The average balance
amounts represent amortized cost for the periods presented.
(4) Nonaccrual loans and related income are included in their respective loan categories.
(5) Includes taxable-equivalent adjustments of $198 million and $191 million for the quarters ended December 31, 2012 and 2011, respectively primarily related to tax-
exempt income on certain loans and securities. The federal statutory tax rate was 35% for the periods presented.
245