Wells Fargo 2012 Annual Report Download - page 202
Download and view the complete annual report
Please find page 202 of the 2012 Wells Fargo annual report below. You can navigate through the pages in the report by either clicking on the pages listed below, or by using the keyword search tool below to find specific information within the annual report.-
 1
1 -
2
-
3
-
4
-
5
-
6
-
7
-
8
-
9
-
10
-
11
-
12
-
13
-
14
-
15
-
16
-
17
-
18
-
19
-
20
-
21
-
22
-
23
-
24
-
25
-
26
-
27
-
28
-
29
-
30
-
31
-
32
-
33
-
34
-
35
-
36
-
37
-
38
-
39
-
40
-
41
-
42
-
43
-
44
-
45
-
46
-
47
-
48
-
49
-
50
-
51
-
52
-
53
-
54
-
55
-
56
-
57
-
58
-
59
-
60
-
61
-
62
-
63
-
64
-
65
-
66
-
67
-
68
-
69
-
70
-
71
-
72
-
73
-
74
-
75
-
76
-
77
-
78
-
79
-
80
-
81
-
82
-
83
-
84
-
85
-
86
-
87
-
88
-
89
-
90
-
91
-
92
-
93
-
94
-
95
-
96
-
97
-
98
-
99
-
100
-
101
-
102
-
103
-
104
-
105
-
106
-
107
-
108
-
109
-
110
-
111
-
112
-
113
-
114
-
115
-
116
-
117
-
118
-
119
-
120
-
121
-
122
-
123
-
124
-
125
-
126
-
127
-
128
-
129
-
130
-
131
-
132
-
133
-
134
-
135
-
136
-
137
-
138
-
139
-
140
-
141
-
142
-
143
-
144
-
145
-
146
-
147
-
148
-
149
-
150
-
151
-
152
-
153
-
154
-
155
-
156
-
157
-
158
-
159
-
160
-
161
-
162
-
163
-
164
-
165
-
166
-
167
-
168
-
169
-
170
-
171
-
172
-
173
-
174
-
175
-
176
-
177
-
178
-
179
-
180
-
181
-
182
-
183
-
184
-
185
-
186
-
187
-
188
-
189
-
190
-
191
-
 192
192 -
 193
193 -
 194
194 -
 195
195 -
 196
196 -
 197
197 -
 198
198 -
 199
199 -
 200
200 -
 201
201 -
 202
202 -
 203
203 -
 204
204 -
 205
205 -
 206
206 -
 207
207 -
 208
208 -
 209
209 -
 210
210 -
 211
211 -
 212
212 -
213
-
214
-
215
-
216
-
217
-
218
-
219
-
220
-
221
-
222
-
223
-
224
-
225
-
226
-
227
-
228
-
229
-
230
-
231
-
232
-
233
-
234
-
235
-
236
-
237
-
238
-
239
-
240
-
241
-
242
-
243
-
244
-
245
-
246
-
247
-
248
-
249
-
250
-
251
-
252
 |
 |

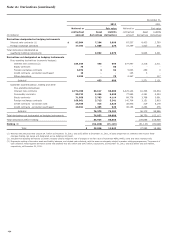
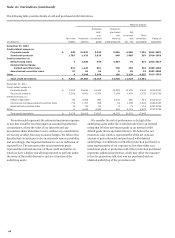
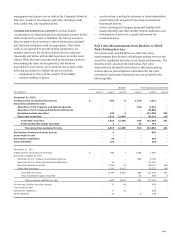
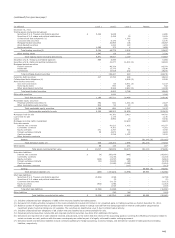
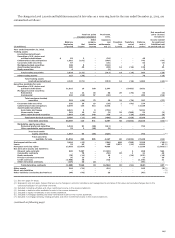
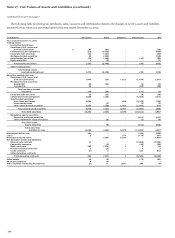
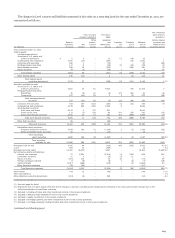
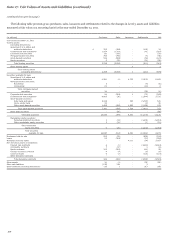
Note 17: Fair Values of Assets and Liabilities
We use fair value measurements to record fair value adjustments
to certain assets and liabilities and to determine fair value
disclosures. Trading assets (excluding derivatives), securities
available for sale, derivatives, substantially all residential MHFS,
certain commercial LHFS, certain loans held for investment, fair
value MSRs and securities sold but not yet purchased (short sale
liabilities) are recorded at fair value on a recurring basis.
Additionally, from time to time, we may be required to record at
fair value other assets on a nonrecurring basis, such as certain
residential and commercial MHFS, certain LHFS, loans held for
investment and certain other assets. These nonrecurring fair
value adjustments typically involve application of lower-of-cost-
or-market accounting or write-downs of individual assets.
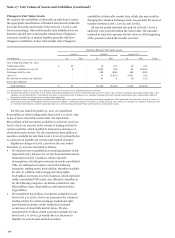
Following are descriptions of the valuation methodologies
used for assets and liabilities recorded at fair value on a
recurring or nonrecurring basis and for estimating fair value for
financial instruments not recorded at fair value.
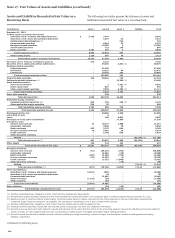
Assets
SHORT-TERM FINANCIAL ASSETS
Short-term financial assets
include cash and due from banks, federal funds sold and
securities purchased under resale agreements and due from
customers on acceptances. These assets are carried at historical
cost. The carrying amount is a reasonable estimate of fair value
because of the relatively short time between the origination of
the instrument and its expected realization.
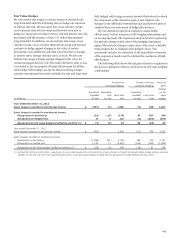
TRADING ASSETS (EXCLUDING DERIVATIVES) AND
SECURITIES AVAILABLE FOR SALE Trading assets and
securities available for sale are recorded at fair value on a
recurring basis. Fair value measurement is based upon various
sources of market pricing. We use quoted prices in active
markets, where available and classify such instruments within
Level 1 of the fair value hierarchy. Examples include exchange-
traded equity securities and some highly liquid government
securities such as U.S. Treasuries. When instruments are traded
in secondary markets and quoted market prices do not exist for
such securities, we generally rely on internal valuation
techniques or on prices obtained from third-party pricing
services or brokers (collectively, vendors) or combination
thereof, and accordingly, we classify these instruments as Level 2
or 3.
Trading securities are mostly valued using internal trader
prices that are subject to price verification procedures performed
by separate internal personnel. The majority of fair values
derived using internal valuation techniques are verified against
multiple pricing sources, including prices obtained from third-
party vendors. Vendors compile prices from various sources and
often apply matrix pricing for similar securities when no price is
observable. We review pricing methodologies provided by the
vendors in order to determine if observable market information
is being used, versus unobservable inputs. When evaluating the
appropriateness of an internal trader price compared with
vendor prices, considerations include the range and quality of
vendor prices. Vendor prices are used to ensure the
reasonableness of a trader price; however valuing financial
instruments involves judgments acquired from knowledge of a
particular market. If a trader asserts that a vendor price is not
reflective of market value, justification for using the trader price,
including recent sales activity where possible, must be provided
to and approved by the appropriate levels of management.
Similarly, while securities available for sale traded in
secondary markets are typically valued using unadjusted vendor
prices or vendor prices adjusted by weighting them with internal
discounted cash flow techniques, these prices are reviewed and,
if deemed inappropriate by a trader who has the most knowledge
of a particular market, can be adjusted. Securities measured with
these internal valuation techniques are generally classified as
Level 2 of the hierarchy and often involve using quoted market
prices for similar securities, pricing models, discounted cash
flow analyses using significant inputs observable in the market
where available or combination of multiple valuation techniques.
Examples include certain residential and commercial MBS,
municipal bonds, U.S. government and agency MBS, and
corporate debt securities.
Security fair value measurements using significant inputs
that are unobservable in the market due to limited activity or a
less liquid market are classified as Level 3 in the fair value
hierarchy. Such measurements include securities valued using
internal models or a combination of multiple valuation
techniques such as weighting of internal models and vendor or
broker pricing, where the unobservable inputs are significant to
the overall fair value measurement. Securities classified as Level
3 include certain residential and commercial MBS, asset-backed
securities collateralized by auto leases or loans and cash
reserves, CDOs and CLOs, and certain residual and retained
interests in residential mortgage loan securitizations. We value
CDOs using the prices of similar instruments, the pricing of
completed or pending third party transactions or the pricing of
the underlying collateral within the CDO. Where vendor or
broker prices are not readily available, we use management's
best estimate.
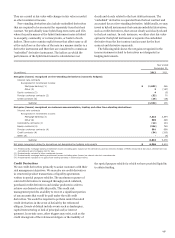
MORTGAGES HELD FOR SALE (MHFS) We carry substantially all
of our residential MHFS portfolio at fair value. Fair value is
based on quoted market prices, where available, or the prices for
other mortgage whole loans with similar characteristics. As
necessary, these prices are adjusted for typical securitization
activities, including servicing value, portfolio composition,
market conditions and liquidity. Most of our MHFS are classified
as Level 2. For the portion where market pricing data is not
available, we use a discounted cash flow model to estimate fair
value and, accordingly, classify as Level 3.
LOANS HELD FOR SALE (LHFS) LHFS are carried at the lower of
cost or market value, or at fair value. The fair value of LHFS is
based on what secondary markets are currently offering for loans
with similar characteristics. As such, we classify those loans
subjected to nonrecurring fair value adjustments as Level 2.
LOANS For information on how we report the carrying value of
loans, including PCI loans, see Note 1. Although most loans are
200